One-third of all traffic fatalities in the US involve a drunk driver with a BAC of .08 or higher. That’s over 10,000 fatalities caused by drunk drivers in 2017 alone. However, drunk driving fatalities are on a downward trend across the county. An 18% decrease nationwide is a positive trend, but any number of drunk driving fatalities are too many.
Key findings:
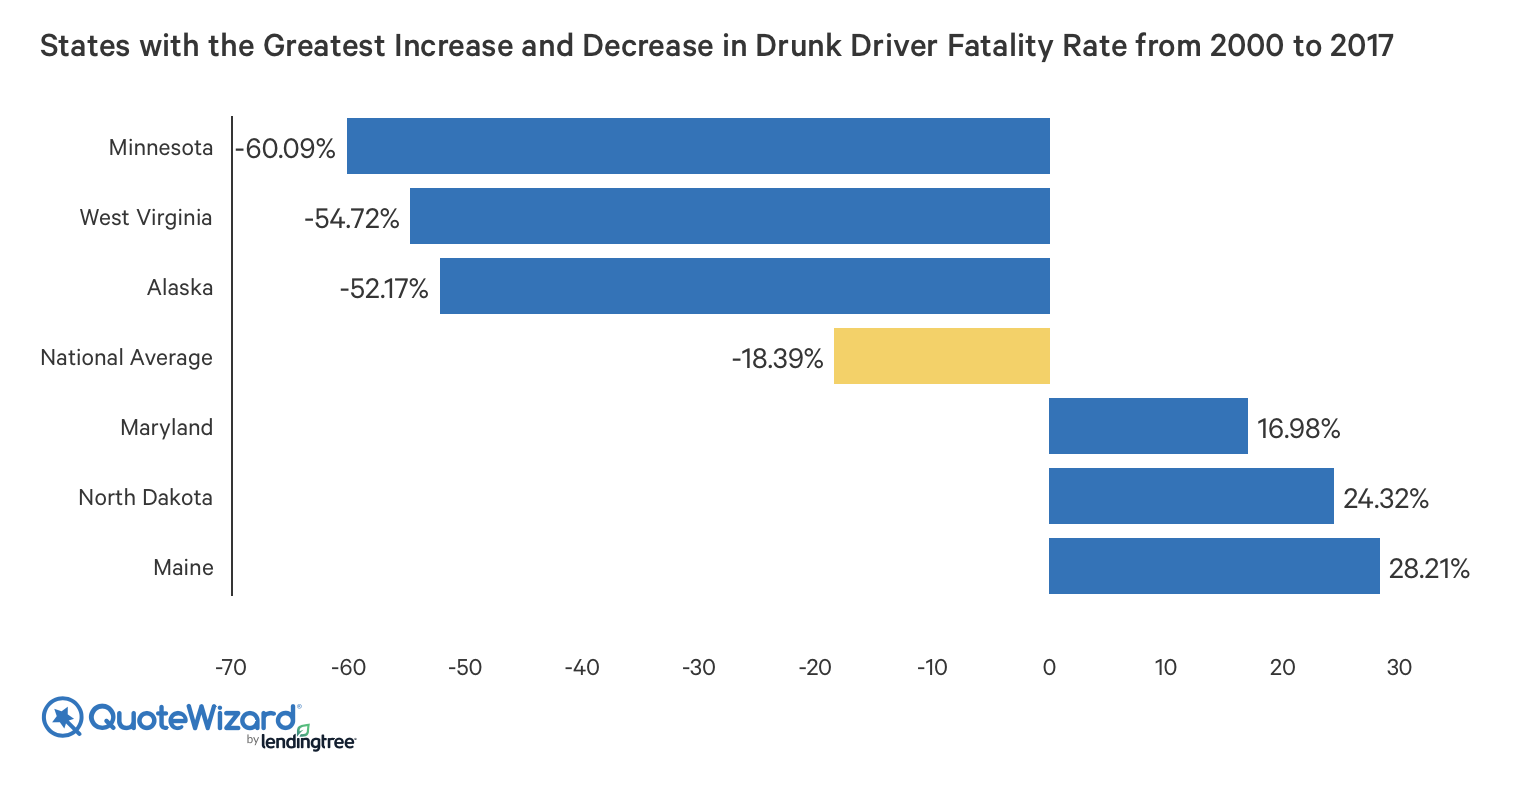
- Drunk driving fatalities nationwide decreased 18% overall from 2000 to 2017.
- 43 states nationwide saw a decrease in drunk driving fatalities from 2000 to 2017.
- Minnesota, West Virginia and Alaska saw the biggest decrease in drunk driving fatalities from 2000 to 2017.
- Oregon, Wyoming, California, Maryland, North Dakota and Maine are the only states that saw increases in drunk driving fatalities.
- Seattle saw a 10% decrease in DUI arrests after Uber launch.
- California reported a 6.5% decrease in alcohol-related crashes after Uber launch.
The overall trend can be attributed to a number of factors, but local enforcement and awareness campaigns such as Drive Sober or Get Pulled Over are big reasons. 43 states have seen a decrease in drunk driving fatalities since 2000. In states with less DUI fatalities, law enforcement’s efforts to catch drunk drivers plus harsher penalties for drunk driving are leading reasons for lower fatality rates. The introduction of rideshare services like Uber and Lyft are also helping keep drunk drivers off the roads. We here at QuoteWizard wanted to see which states have seen the biggest decrease in drunk driving fatalities.
Rankings
We analyzed NHTSA drunk driving fatality data to see which states had the biggest decrease in drunk driving fatality rates from 2000 to 2017. States are ranked based on the largest decrease in DUI fatality rates. Drunk driving fatality data is based on the total number of fatal accidents where drivers had a BAC (blood alcohol concentration) of .08+.
| Rank (largest decrease) | State | Fatalities in 2000 | Fatalities in 2017 | Rate of Fatalities |
|---|---|---|---|---|
| 1 | Minnesota | 213 | 85 | -60.09% |
| 2 | West Virginia | 159 | 72 | -54.72% |
| 3 | Alaska | 46 | 22 | -52.17% |
| 4 | Mississippi | 302 | 148 | -50.99% |
| 5 | South Dakota | 67 | 35 | -47.76% |
| 6 | New Jersey | 228 | 125 | -45.18% |
| 7 | Montana | 100 | 56 | -44.00% |
| 8 | Missouri | 432 | 254 | -41.20% |
| 9 | Pennsylvania | 533 | 314 | -41.09% |
| 10 | Louisiana | 354 | 212 | -40.11% |
| 11 | Tennessee | 415 | 251 | -39.52% |
| 12 | Utah | 84 | 53 | -36.90% |
| 13 | New Hampshire | 42 | 27 | -35.71% |
| 14 | Wisconsin | 295 | 190 | -35.95% |
| 15 | Idaho | 88 | 60 | -31.82% |
| 16 | Vermont | 26 | 18 | -30.77% |
| 17 | Ohio | 467 | 333 | -28.69% |
| 18 | Illinois | 488 | 349 | -28.48% |
| 19 | Delaware | 44 | 32 | -27.27% |
| 20 | Alabama | 355 | 268 | -24.50% |
| 21 | Kansas | 135 | 102 | -24.44% |
| 22 | Michigan | 400 | 311 | -22.25 |
| 23 | Iowa | 113 | 88 | -22.12% |
| 24 | Massachusetts | 152 | 120 | -21.05% |
| 25 | Washington | 224 | 178 | -20.53% |
| 26 | New Mexico | 151 | 120 | -20.52% |
| 27 | Arizona | 347 | 278 | -19.88% |
| 28 | South Carolina | 388 | 313 | -19.32% |
| 29 | Kentucky | 222 | 181 | -18.46% |
| 30 | Nevada | 108 | 89 | -17.59% |
| 31 | Georgia | 434 | 366 | -15.66% |
| 32 | Arkansas | 162 | 140 | -13.58% |
| 33 | Virginia | 280 | 246 | -12.14% |
| 34 | North Carolina | 470 | 413 | -12.12% |
| 35 | New York | 329 | 295 | -10.33% |
| 36 | Oklahoma | 179 | 165 | -7.82% |
| 37 | Colorado | 192 | 177 | -7.81% |
| 38 | Nebraska | 72 | 67 | -6.94% |
| 39 | Florida | 891 | 839 | -5.83% |
| 40 | Connecticut | 127 | 120 | -5.51% |
| 41 | Indiana | 227 | 220 | -3.08% |
| 42 | Texas | 1499 | 1468 | -2.06% |
| 43 | Hawaii | 42 | 42 | 0.00% |
| 44 | Rhode Island | 34 | 34 | 0.00% |
| 45 | Oregon | 129 | 137 | 6.20% |
| 46 | Wyoming | 39 | 44 | 12.82% |
| 47 | California | 987 | 1120 | 13.47% |
| 48 | Maryland | 159 | 186 | 16.98% |
| 49 | North Dakota | 37 | 46 | 24.32% |
| 50 | Maine | 39 | 50 | 28.21% |
Introduction of rideshare reducing drunk driving fatalities
From the year 2000 to 2017, technology has made major advances in consumer services. Smartphones make nearly everything one touch away, including a ride through Uber or Lyft. While ridesharing services are still fairly new and their impact on reducing drunk driving is not strongly correlated, there are still some promising figures that show ridesharing does help reduce drunk driving.
In 2013 when Uber began operations in Seattle, a company study found their entry into the market was associated with a 10% decrease in DUI arrests. Uber’s ridership trends show that demand for rides peak around times when drunk driving accidents occur most. Studies from Temple University and West Carolina University also show the introduction of ridesharing services around the country lead to a decline in fatal accidents.
Affordable and easy to use transportation wasn’t so widely available in 2000, but it’s now common. Technology is playing a role in reducing drunk driving fatalities. The human error and human element of judgement is still similar from 2000 to 2017. Now we’re able to leverage technology to avoid situations where we’re getting behind the wheel drunk.
Methodology
QuoteWizard analysts compared NHTSA drunk driving fatality data to find the rate of drunk driving fatalities in each state from the year 2000 to 2017. States are ranked based on the largest decrease in drunk driving fatality rates over the same time period. Drunk driving fatality data is based on the total number of fatal accidents where drivers had a BAC (blood alcohol concentration) of .08+.
References:
QuoteWizard.com LLC has made every effort to ensure that the information on this site is correct, but we cannot guarantee that it is free of inaccuracies, errors, or omissions. All content and services provided on or through this site are provided "as is" and "as available" for use. QuoteWizard.com LLC makes no representations or warranties of any kind, express or implied, as to the operation of this site or to the information, content, materials, or products included on this site. You expressly agree that your use of this site is at your sole risk.