Key Findings:
- Plainfield, Charleston and Moline among worst drivers in Illinois.
- Harvey, Evanston and Calumet City named best drivers in the state.
- Illinois ranked 5th best driving state in 2018 QuoteWizard study.
- Chicago ranked 3rd best driving city in the country.
- 19% of Illinois roads in poor condition, state only spending 4% on road repairs.
- 11th best state for distracted driving.
We here at QuoteWizard wanted to give Illinois drivers a full view of how good or bad their driving is, where the best and worst drivers are, and if the roads are in good condition. All factors leading to the overall driver score for drivers of Illinois. To get the full driver report we analyzed over 134,000 insurance quotes from users of QuoteWizard.com, along with data from the Federal Highway Administration (FHA) and the National Association of Insurance Commissioners (NAIC) to score Illinois drivers. Factors included in the Illinois driver report are the following:
- Driver quality in cities
- Distracted drivers
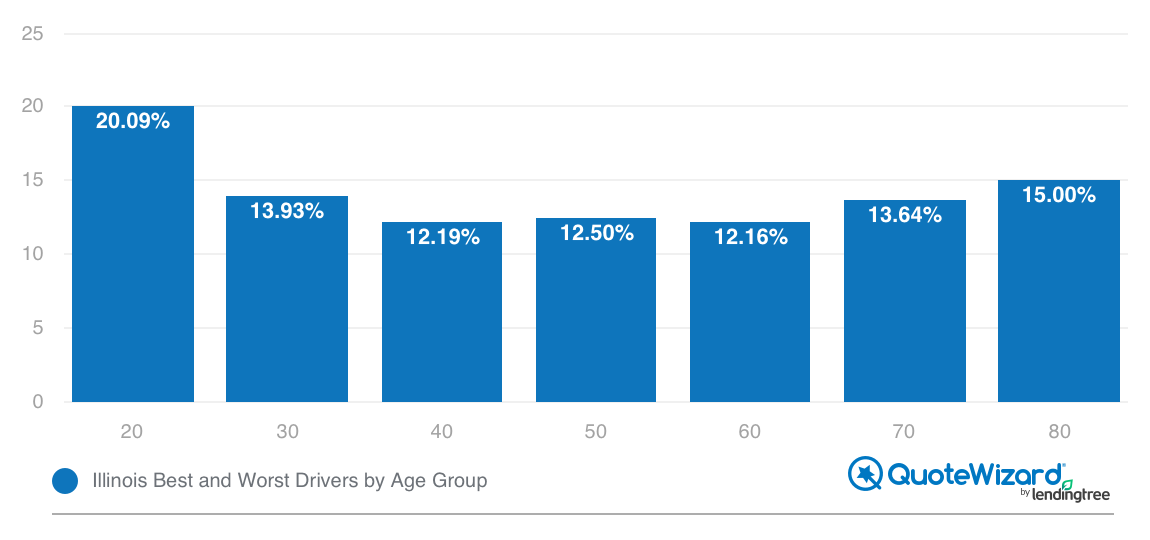
- Driver quality by age group
- Road infrastructure
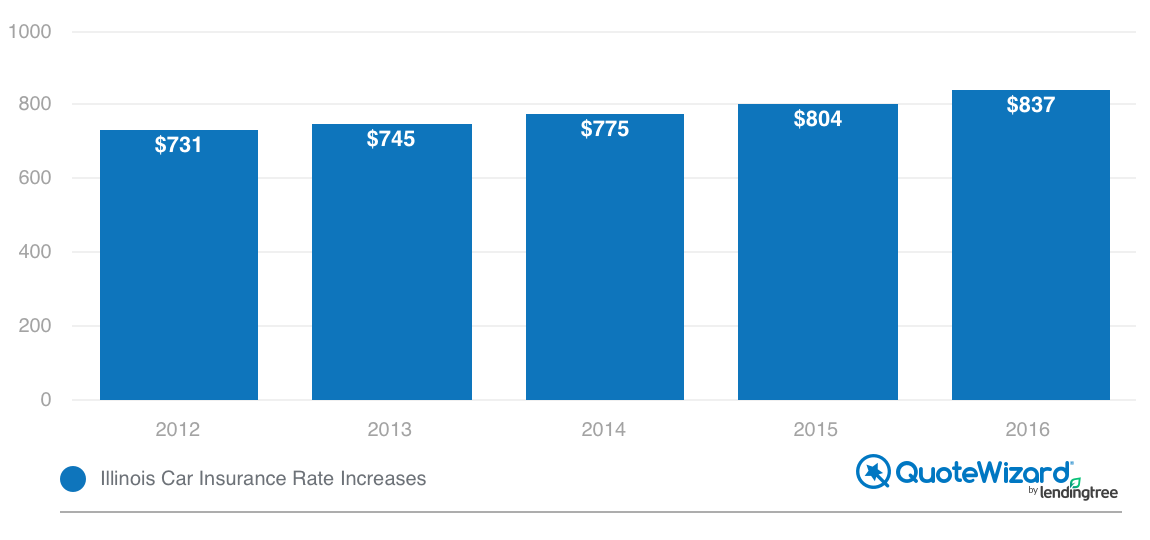
- Car insurance increases
Illinois driver grade: A. Grading Illinois drivers with an A is likely to be met with disagreement among local drivers who brave the roads of Illinois every day. However, we here at QuoteWizard have studied driver behavior across the country for many years and Illinois regularly rates among the best state in most categories. Chicago is even considered one of the best driving cities in the country. A low rate of distracted drivers and decent infrastructure make Illinois all the most welcoming for quality drivers. Next time you get cut off or get your doors blown off by a fellow Illinois driver, just know it could be much worse. You don’t want to know what it’s like to share the road with California drivers.
Best and worst drivers in Illinois
Every year QuoteWizard analyzes car insurance data to see where the best and worst drivers are. We produce studies that rank all 50 states for best and worst. We also produce a city study that compares the biggest 75 cities in the country. In both studies, year over year, Illinois and Chicago rate among the best in the country. In 2018 Illinois ranked 5th best driving state, while Chicago came in at the 3rd best driving city in the country.
Drivers in the Chicagoland area could debate that ranking, but when we dig into the best and worst drivers in Illinois you’ll see neighboring cities atop the best list. Harvey, Evanston and Calumet City top the list of best driving cities. All Chicagoland cities. When it comes to the worst driving cities, they are mostly outside of Chicagoland. Even Moline is nearly in Iowa.
Typically around the country we see busy suburban cities like Harvey, Evanston and Calumet City be among the worst driving cities. Heavy traffic in and out of the big city passing through town will usually lead to a higher rate of incidents. Similarly, we see more rural cities outside of the big city be among the best drivers because of limited traffic passing through town. Illinois cities buck this trend and have quite the opposite impact. Tip of the hat to Chicagoland drivers for truly being among the best of the best.
To determine overall driver quality in Illinois, we analyzed driver quality in Illinois’ largest cities who used QuoteWizard.com to compare quotes. We then ranked the worst 10 and best 10 cities by the highest rate of incidents. Incidents include accidents, speeding tickets, DUIs and moving citations from that data. Cities with the highest rate of incidents were listed as the worst driving cities.
Worst driving cities in Illinois
| Rank (worst) | City |
|---|---|
| 1 | Plainfield |
| 2 | Charleston |
| 3 | Moline |
| 4 | Woodstock |
| 5 | East Moline |
| 6 | Crystal Lake |
| 7 | Rock Island |
| 8 | Pekin |
| 9 | Normal |
| 10 | Lockport |
Best driving cities in Illinois
| Rank (best) | City |
|---|---|
| 1 | Harvey |
| 2 | Evanston |
| 3 | Calumet City |
| 4 | Danville |
| 5 | Centralia |
| 6 | Riverdale |
| 7 | Carbondale |
| 8 | Zion |
| 9 | Peoria |
| 10 | Blue Island |
Illinois infrastructure rating
Earlier this year QuoteWizard conducted a study on which states had the best and worst infrastructure. We analyzed FHA data to rank states on quality of road infrastructure and found Illinois to be 22nd which puts the state in the bottom half of infrastructure quality. Rankings were a composite score of the following factors:
- Roads in poor condition (%): Illinois 19%
- Cost per motorist (due to roads in need of repair): Illinois $586
- Bridges structurally deficient (%): Illinois 8%
The middle of the pack ranking for infrastructure was due to average across the board numbers. The roads in poor condition figure of 19% was an above average nationwide. However the $586 cost per motorist and 8% structurally deficient bridges brought down Illinois overall ranking. The troubling figure that could lead to a decline in ranking is the 4% of highway spending on road repairs. While 19% of roads in poor condition isn’t terrible the lack of spending now can lead to worsening road conditions in the coming years.
Best and worst drivers by age group
As most drivers would guess, the young 20 year olds were the worst driving age group. Far and away the highest rate of incidents among their older age groups. That’s typically around the country. The more driving experience you have the less likely you’re getting into an incident. Responsibility does come with age. However, we’ve been noticing a trend in other states that Illinois also has. The 70 and 80 year old age groups begin to see a higher rate of incidents than their middle-aged counterparts.

Most popular vehicles by age group
When looking at each generational vehicle preference, it’s clear to see the millennials driving cars while gen x and baby boomers love their trucks. The F-150 is the most popular car for both gen x and baby boomers. F-150 is also the most expensive vehicle among the popular cars.
We see this trend for millennials and their vehicles of choice. They tend to be cheaper cars. While not by a large margin, millennials average MSRP of their popular vehicles is less than the other generations. Financially, millennials are the generation of student debts and still too young to be building significant wealth. However, that might not tell the whole story of why millennials are opting for cheaper cars. With millennials moving to cities like Chicago at a higher rate, there’s more transportation options available. With more public transit, along with ridesharing like Uber and Lyft, millennials have more options than getting behind the wheel. While millennials are still owning cars, the need to spend on a nice car has less precedence when there are other forms of transportation available.
Millennials (23-38)
Average MSRP: $21,266
| Rank | Model | MSRP |
|---|---|---|
| 1 | Altima | $24,100 |
| 2 | Camry | $24,295 |
| 3 | Focus | $17,950 |
| 4 | Sentra | $17,890 |
| 5 | Malibu | $22,095 |
Gen X (30-45)
Average MSRP: $22,546
| Rank | Model | MSRP |
|---|---|---|
| 1 | F-150 | $28,495 |
| 2 | Altima | $24,100 |
| 3 | Sentra | $17,890 |
| 4 | Focus | $17,950 |
| 5 | Camry | $24,295 |
Baby Boomer (55-75)
Average MSRP: $22,486
| Rank | Model | MSRP |
|---|---|---|
| 1 | F-150 | $28,495 |
| 2 | Camry | $24,295 |
| 3 | Focus | $17,950 |
| 4 | Equinox | $13,800 |
| 5 | Sentra | $17,890 |
Car insurance getting more expensive in Illinois
From 2012 to 2016 Illinois drivers have seen their car insurance rates increase on average by 14%. That is right around the national average, but rates have increased in every state during the same time frame. Drivers are seeing their car insurance premiums go up by an average of $150 year in that same five year span. That makes Illinois the 21st highest increase in the country.

QuoteWizard.com LLC has made every effort to ensure that the information on this site is correct, but we cannot guarantee that it is free of inaccuracies, errors, or omissions. All content and services provided on or through this site are provided "as is" and "as available" for use. QuoteWizard.com LLC makes no representations or warranties of any kind, express or implied, as to the operation of this site or to the information, content, materials, or products included on this site. You expressly agree that your use of this site is at your sole risk.