Childbirth is declining nationwide. Our team of analysts found that births have declined by 7% since 2016. Add it up and nearly 350,000 fewer children were born in 2020 than in 2016.
Over the last six years, births have declined in every year except one: 2021. That’s because the coronavirus pandemic had a unique effect on births. In 2020, during the height of the pandemic, fewer children were born than at any point in the last 36 years. However, in 2021, births went back up. We found that childbirth rates increased by nearly 2% between 2020 and 2021.
Key findings:
- Childbirths have declined by 7% since 2016
- Alaska has had the steepest decline in childbirths at nearly 20%
- New Hampshire and Tennessee are the only states that have seen increases in births
States with the largest declines in childbirths
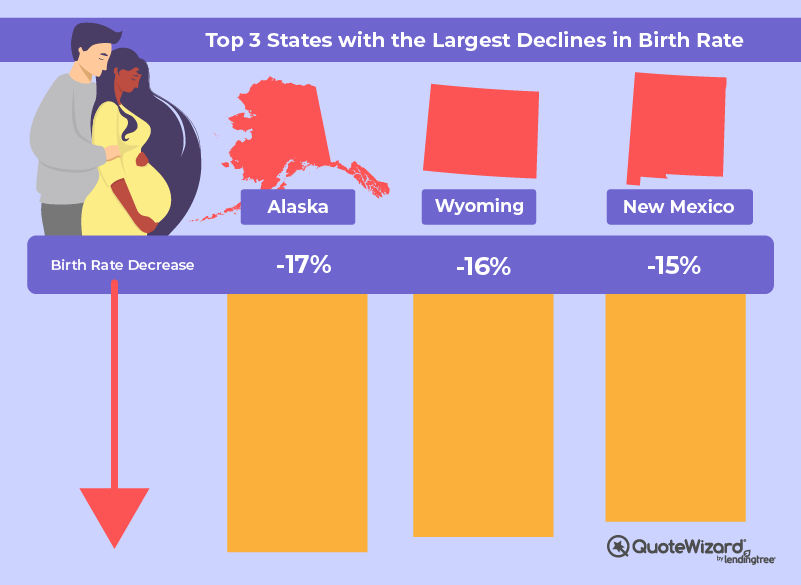
The number of children being born has declined by nearly 20% in some states. Alaska, Wyoming and New Mexico have seen the steepest declines in childbirths. New Hampshire and Tennessee are the only states where we found an increase in the number of births.

| State | 2016 Births | 2021 Births | % Change |
|---|---|---|---|
| Alaska | 11,209 | 9,258 | -17% |
| Wyoming | 7,386 | 6,230 | -16% |
| New Mexico | 24,692 | 20,910 | -15% |
| Illinois | 154,445 | 132,117 | -14% |
| California | 488,827 | 420,031 | -14% |
| Hawaii | 18,059 | 15,565 | -14% |
| North Dakota | 11,383 | 10,108 | -11% |
| West Virginia | 19,079 | 17,080 | -10% |
| Oregon | 45,535 | 40,868 | -10% |
| New York | 234,283 | 210,359 | -10% |
| Louisiana | 63,178 | 57,218 | -9% |
| Kansas | 38,053 | 34,690 | -9% |
| Montana | 12,282 | 11,222 | -9% |
| Oklahoma | 52,592 | 48,350 | -8% |
| Arizona | 84,520 | 77,891 | -8% |
| Minnesota | 69,749 | 64,398 | -8% |
| Nebraska | 26,589 | 24,555 | -8% |
| Michigan | 113,315 | 104,830 | -7% |
| Utah | 50,464 | 46,701 | -7% |
| South Dakota | 12,275 | 11,368 | -7% |
| Washington | 90,505 | 83,838 | -7% |
| Wisconsin | 66,615 | 61,719 | -7% |
| Mississippi | 37,928 | 35,146 | -7% |
| Nevada | 36,260 | 33,655 | -7% |
| Missouri | 74,705 | 69,375 | -7% |
| Virginia | 102,460 | 95,544 | -7% |
| Maryland | 73,136 | 68,262 | -7% |
| Iowa | 39,403 | 36,783 | -7% |
| Vermont | 5,756 | 5,383 | -6% |
| Texas | 398,047 | 373,340 | -6% |
| Arkansas | 38,274 | 35,902 | -6% |
| Ohio | 138,085 | 129,717 | -6% |
| Kentucky | 55,449 | 52,144 | -6% |
| Colorado | 66,613 | 62,900 | -6% |
| Maine | 12,705 | 12,003 | -6% |
| Pennsylvania | 139,409 | 132,401 | -5% |
| Georgia | 130,042 | 123,939 | -5% |
| Delaware | 10,992 | 10,477 | -5% |
| Indiana | 83,091 | 79,760 | -4% |
| Florida | 225,022 | 216,236 | -4% |
| Rhode Island | 10,798 | 10,458 | -3% |
| Massachusetts | 71,317 | 69,142 | -3% |
| Alabama | 59,151 | 58,032 | -2% |
| New Jersey | 102,647 | 101,457 | -1% |
| Connecticut | 36,015 | 35,646 | -1% |
| North Carolina | 120,779 | 119,792 | -1% |
| South Carolina | 57,342 | 57,129 | 0% |
| Idaho | 22,482 | 22,426 | 0% |
| Tennessee | 80,807 | 81,675 | 1% |
| New Hampshire | 12,267 | 12,615 | 3% |
| United States | 3,936,017 | 3,650,645 | -7% |
Why births are declining is a complicated issue. Societal trends, the economy and lower infant mortality rates likely all play a role. Cost can also be a prohibitive factor. Alaska has seen the largest decline in childbirths over the last six years; it’s also the most expensive state to have a child in.
Planning for unexpected childbirth costs
Depending on where you live, having a child can cost between $21,000 and $37,000 in the first year alone. And that’s just for labor, health insurance and child care. If we add in unexpected costs, having a child can cost hundreds of thousands more.
There are some ways to plan for unexpected childbirth costs. Unexpected costs usually arise from complications or additional testing, so choosing the right health insurance plan and understanding what’s covered is key.
A health savings account is a great way to save for unexpected costs because it allows you to put away money tax free for unexpected costs. Parents should also thoroughly review their medical bills to make sure the charges are accurate.
Methodology:
QuoteWizard analyzed the CDC National Center for Health Statistics’ provisional number of births. To rank states that have seen the biggest decreases in births, we found the change of provisional births over a five-year period from 2016 to 2021.
References:
QuoteWizard.com LLC has made every effort to ensure that the information on this site is correct, but we cannot guarantee that it is free of inaccuracies, errors, or omissions. All content and services provided on or through this site are provided "as is" and "as available" for use. QuoteWizard.com LLC makes no representations or warranties of any kind, express or implied, as to the operation of this site or to the information, content, materials, or products included on this site. You expressly agree that your use of this site is at your sole risk.
