Key findings:
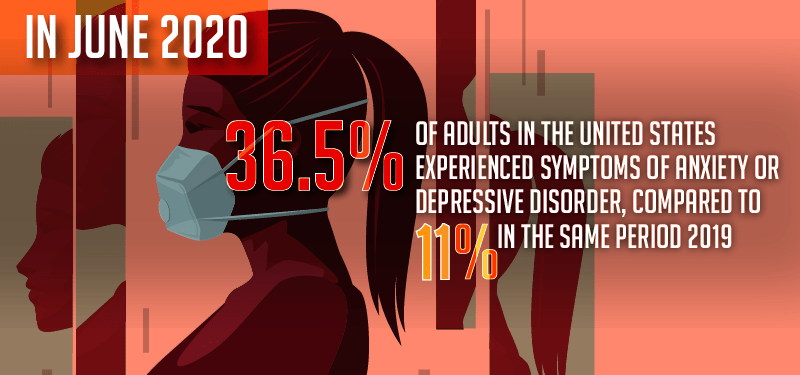
- In June 2020, 36.5% of adults in the United States experienced symptoms of anxiety or depressive disorder, compared to 11% in the same period in 2019.
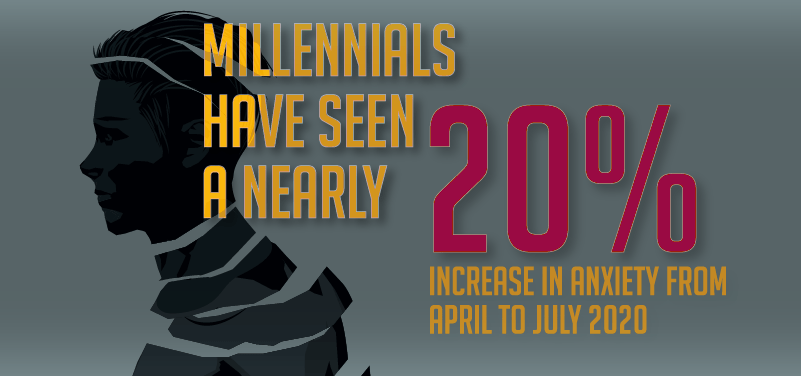
- Millennials have seen nearly a 20% increase in anxiety from April to July 2020.
- California, Hawaii and Arizona are considered to be the least mobile states due to COVID-19-related restrictions.
- A 9% reduction in retail and recreation activities in the U.S. means lower levels of mobility.
- About 33% of people are choosing to stay at home compared to pre-coronavirus rates.
How stay-at-home orders have decreased mobility
With one-third of Americans choosing to stay home during the COVID-19 pandemic, there’s been a decline in America’s mobility. Mobility can be looked at as the rate at which people are getting out of the house and traveling to work, retail and recreation. Google and the Centers for Disease Control and Prevention (CDC) teamed up to look at Americans’ mobility during the pandemic and compared it to a baseline of pre-pandemic numbers. This comparison shows where people are more and less mobile during the pandemic.
We here at QuoteWizard looked at which states have seen the the least mobility compared to states with the most mobility during the pandemic. To evaluate each state's mobility, we analyzed Google and CDC trends data for rate of retail and recreation as a percentage compared to pre-pandemic baselines and the percentage of residents staying at home. Final rankings are a composite ranking to show which states are most and least mobile during the pandemic.
When comparing states’ mobility, we found a strong correlation between the higher percentage of people staying at home and a large decline in retail and recreation. California was found to be the least mobile according to our data. California was among the states with the highest rates of people staying at home and the greatest declines in recreation. Arizona, New York and Washington were also states that saw both high rates of people staying home and low levels of recreation. Many of our top states were those that saw some of the strictest stay-at-home orders from local governments, with California being in their second round of restrictions. On the other end of the spectrum, the states with the most mobility during the pandemic were states that saw few stay-at-home restrictions from local governments. State-mandated restrictions certainly play a role in limited mobility, but the numbers of cases in those states are also keeping people in their homes. Among the top 15 states for limited mobility, you’ll find many are seeing the most COVID-19 cases.

Limited mobility is a likely cause of added mental health strain for many in those states where mobility is limited. In June 2020, 36.5% of adults in the United States experienced symptoms of anxiety or depressive disorder, compared to 11% in the same period 2019. While stress factors like fear of contracting COVID-19 and unemployment are likely leaders in feelings of anxiety or depression, limited mobility keeps people from living their usual lives, such as going out to restaurants with friends or shopping at their favorite stores. Largely less stressful than other factors, but it affects a larger group of people. The hardest-hit group from limited mobility is the millennial age group. Not being able to go out and socialize with friends puts stress primarily on younger people. Millennials reported seeing a 20% increase in anxiety from April to July, larger than any other age group. The new reality of spending most of our time at home and not having the luxuries of going out and being social can take a toll on our mental health. Added anxieties from financial and health implications make the limited mobility all the more difficult for people to deal with mentally.

Methodology
We here at QuoteWizard analyzed Google and CDC data that looked at mobility factors during the COVID-19 pandemic. We built a composite ranking of each state based on two key mobility factors: the rate of retail and recreation and the rate of people staying at home. These mobility factors are ranked to show which states are considered to be least mobile by comparison. Each rate of retail and recreation and people staying at home is based on historical norms. States with negative rates of retail and recreation are considered to be lower than normal. States with high rates of people staying at home are considered to be higher than normal
| Rank | State | % Recreation and Retail | % At Home |
|---|---|---|---|
| 1 | California | -30 | 35 |
| 2 | Hawaii | -33 | 34 |
| 3 | Arizona | -23 | 34 |
| 4 | New York | -21 | 34 |
| 5 | Nevada | -19 | 34 |
| 6 | Maryland | -14 | 36 |
| 7 | Massachusetts | -14 | 35 |
| 8 | New Jersey | -18 | 33 |
| 9 | Washington | -15 | 32 |
| 10 | Florida | -21 | 31 |
| 11 | New Mexico | -14 | 32 |
| 12 | Connecticut | -10 | 33 |
| 13 | Pennsylvania | -12 | 31 |
| 14 | Oregon | -11 | 31 |
| 15 | Texas | -15 | 28 |
| 16 | Vermont | -8 | 32 |
| 17 | Virginia | -8 | 32 |
| 18 | Utah | -11 | 30 |
| 19 | Illinois | -11 | 29 |
| 20 | Rhode Island | -3 | 34 |
| 21 | Colorado | -10 | 29 |
| 22 | Michigan | -9 | 28 |
| 23 | Delaware | -1 | 34 |
| 24 | Minnesota | -8 | 28 |
| 25 | North Carolina | -7 | 28 |
| 26 | Ohio | -7 | 28 |
| 27 | Kentucky | -8 | 27 |
| 28 | Louisiana | -12 | 24 |
| 29 | Georgia | -9 | 26 |
| 30 | Wisconsin | -7 | 27 |
| 31 | New Hampshire | 1 | 31 |
| 32 | Idaho | -3 | 28 |
| 33 | West Virginia | -5 | 27 |
| 34 | Alaska | 8 | 31 |
| 35 | Maine | 8 | 31 |
| 36 | Montana | 2 | 30 |
| 37 | Indiana | -3 | 27 |
| 38 | South Carolina | -5 | 25 |
| 39 | Tennessee | -5 | 25 |
| 40 | Kansas | -3 | 26 |
| 41 | North Dakota | -4 | 25 |
| 42 | Wyoming | 9 | 28 |
| 43 | Alabama | -7 | 22 |
| 44 | Arkansas | -4 | 24 |
| 45 | Iowa | -3 | 24 |
| 46 | Missouri | 1 | 26 |
| 47 | Mississippi | -4 | 21 |
| 48 | Nebraska | -2 | 23 |
| 49 | Oklahoma | -2 | 23 |
| 50 | South Dakota | 6 | 24 |
References:
QuoteWizard.com LLC has made every effort to ensure that the information on this site is correct, but we cannot guarantee that it is free of inaccuracies, errors, or omissions. All content and services provided on or through this site are provided "as is" and "as available" for use. QuoteWizard.com LLC makes no representations or warranties of any kind, express or implied, as to the operation of this site or to the information, content, materials, or products included on this site. You expressly agree that your use of this site is at your sole risk.