Key Findings:
- September is the most dangerous month to drive in with an average of 1.15 fatal crashes per 100 million vehicle miles traveled from 2007 to 2017.
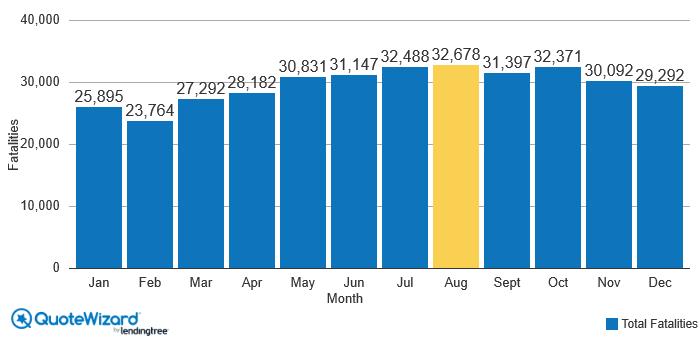
- August had 32,678 total fatalities, most of any month from 2007 to 2017.
- From 2011 to 2015 Thanksgiving and Labor Day had the highest number of fatalities among holidays.
- According to AAA, 62% of people plan road trips in the fall.
- Summer and fall months have the most vehicle miles traveled during the calendar year
When the season turns from cold to warm it gets people out of the house and enjoying the great outdoors. Summer and fall months in particular are the best times to hit the road in search of outdoor activities. The most popular months for road trips according to AAA are fall months, with 62% of people planning a road trip in the fall. The months of May through October have the highest number of vehicle miles traveled during the year. The unfortunate aspect of having so many cars on the road in the warmer months is a strong correlation to road fatalities. More cars on the road means more fatalities.
We here at QuoteWizard analyzed NHTSA fatality rates by month to see which months out of the year were most dangerous for drivers. We looked at each month’s fatal crash rate per 100 million vehicle miles traveled from 2007 to 2017 to find which month had the highest average fatal crash rate. Rankings are from most to least dangerous months based on the average fatal crash rate from 2007 to 2017.
Most dangerous months by fatal crashes per 100 million vehicle miles traveled
| Rank (most dangerous) | Month | Fatal Crash Rate per 100 MM VMT |
|---|---|---|
| 1 | September | 1.15 |
| T-2 | November | 1.12 |
| T-2 | October | 1.12 |
| T-4 | August | 1.11 |
| T-4 | July | 1.10 |
| 6 | December | 1.08 |
| 7 | June | 1.07 |
| 8 | May | 1.06 |
| 9 | January | 1.02 |
| 10 | April | 1.00 |
| 11 | February | 0.99 |
| 12 | March | 0.97 |
Most dangerous months by total fatal accidents
QuoteWizard also analyzed NHTSA data from 2007 to 2017 to see which months had the greatest total number of fatalities over the same time period. As confirmed by the above rankings for fatalities by vehicle miles traveled, summer and fall months are the most dangerous by total fatalities.
Dangerous summer and fall holiday travel
Some of the most traveled holidays in the United States are in the summer and fall months. With days off at a time, it’s a great opportunity to hop in the car for outdoor adventures or to meet up with friends and family. With so many cars on the road on a single holiday there is heightened risk for crashes. Pair that with alcohol consumed on the holiday, these specific times of year become some of the deadliest on the road.
We looked at NHTSA data from 2011 to 2015 to see which summer and fall holidays had the highest number of fatalities and what percent of those fatal accidents involved alcohol impaired drivers.
| Holiday | Fatalities | % of Alcohol Impaired |
|---|---|---|
| Thanksgiving | 1,929 | 35.5% |
| Labor Day | 1,878 | 38.5% |
| Independence Day | 1,736 | 40.5% |
| Memorial Day | 1,684 | 39.5% |
According to an IIHS Status Report, most fatalities occur on Friday, Saturday and Sunday. Given all the summer and fall holidays (except Independence Day) are celebrated over a weekend, makes the holiday weekend travels some of the most dangerous times to drive the entire year.
Methodology
QuoteWizard auto insurance analysts looked at NHTSA FARS fatal crashes and crash rates by month data from year 2007 to 2017. Rankings are based on months with the highest average fatal crash rate per 100 million vehicle miles traveled from 2007 to 2017.
QuoteWizard.com LLC has made every effort to ensure that the information on this site is correct, but we cannot guarantee that it is free of inaccuracies, errors, or omissions. All content and services provided on or through this site are provided "as is" and "as available" for use. QuoteWizard.com LLC makes no representations or warranties of any kind, express or implied, as to the operation of this site or to the information, content, materials, or products included on this site. You expressly agree that your use of this site is at your sole risk.