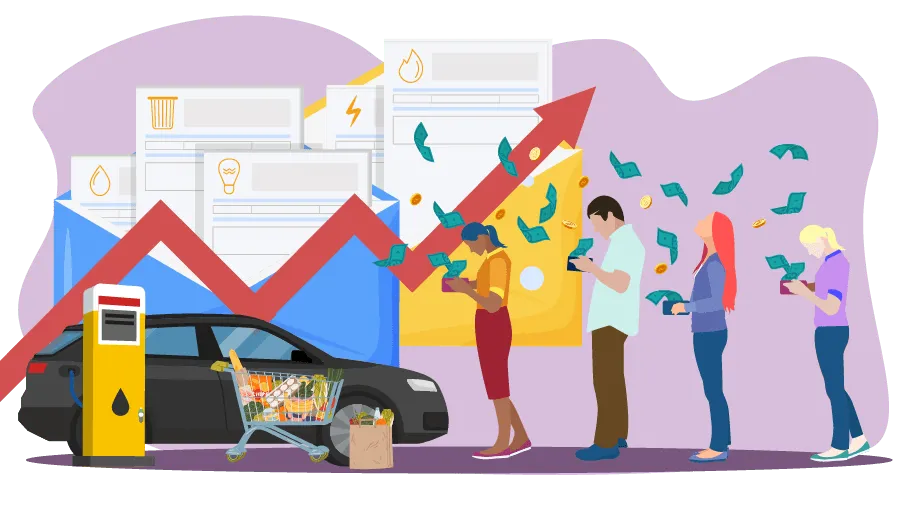
Changing economic conditions are making it more difficult for people to afford household expenses. Our team of analysts found that the number of people who said they were having a “very difficult” time paying for their usual household expenses has increased by 85% since June.
Key findings:
- 60% of people say they are having some difficulty meeting their usual household expenses
- 15% of people say they are having a “very difficult” time paying household expenses.
- The number of people having a “very difficult” time has increased by 85% nationwide and by as much as 201% in some states.
- Louisiana, Florida and Georgia have the highest numbers of people having a “very difficult” time.
Inflation is the main reason why people are having a harder time meeting expenses. Overall inflation is up 8.3% since last year, but prices for food and fuel have gone up even more. The rise in prices has hit certain states particularly hard.
We looked at the number of people in each state who said they were having either “no difficulty,” “slight to moderate difficulty” or a “very difficult” time meeting their usual household expenses. Rhode Island is the only state where money matters have gotten easier over the last year. In the other 49 states, the number of people having a “very difficult” time meeting their usual household expenses has risen by as much as 200%.
| State | % having a very difficult time - June 2021 | % having a very difficult time - May 2022 | % change since June |
|---|---|---|---|
| Alabama | 11% | 17% | 55% |
| Alaska | 11% | 14% | 27% |
| Arizona | 8% | 13% | 61% |
| Arkansas | 5% | 15% | 201% |
| California | 9% | 15% | 63% |
| Colorado | 7% | 11% | 63% |
| Connecticut | 8% | 13% | 66% |
| Delaware | 10% | 12% | 19% |
| Florida | 8% | 22% | 173% |
| Georgia | 11% | 20% | 83% |
| Hawaii | 9% | 12% | 32% |
We also found significant changes in the number of people who reported having “no difficulty” or “slight to moderate difficulty.” Nationwide, there was a 20% decrease in people who reported having “no difficulty” and a 15% increase in people who had “slight to moderate difficulty.”
The table below shows the percentage of people in each state experiencing various levels of difficulty meeting their household expenses. Louisiana and Florida had the highest number of people having a “very difficult” time, Minnesota and Wisconsin had the most people with “no difficulty” and Mississippi had the highest percentage of people experiencing “slight to moderate difficulty” meeting their usual expenses.
| State | % with no difficulty | % with slight to moderate difficulty | % having a very difficult time |
|---|---|---|---|
| Alabama | 37% | 46% | 17% |
| Alaska | 45% | 41% | 14% |
| Arizona | 39% | 48% | 13% |
| Arkansas | 36% | 49% | 15% |
| California | 40% | 45% | 15% |
| Colorado | 47% | 41% | 11% |
| Connecticut | 45% | 42% | 13% |
| Delaware | 39% | 49% | 12% |
| Florida | 33% | 45% | 22% |
| Georgia | 36% | 44% | 20% |
| Hawaii | 35% | 53% | 12% |
| *Percentages are rounded so many not add up to 100% | |||
The data presented above shows just how quickly a change in prices can impact people’s financial situation. Inflation is currently at a 40-year high, and we predict that people’s financial situations will continue to drastically change the higher it goes.
Methodology:
We analyzed state-by-state data from the Household Pulse Survey data on the percentage of individuals who had a “very difficult” time meeting usual household expenses over the seven-day moving average dates of June 3, 2021, compared to May 1, 2022. Also included in the second table are the absolute percentages of people with “no difficulty” and “slight to moderate difficulty” in meeting the usual monthly expenses.
References:
QuoteWizard.com LLC has made every effort to ensure that the information on this site is correct, but we cannot guarantee that it is free of inaccuracies, errors, or omissions. All content and services provided on or through this site are provided "as is" and "as available" for use. QuoteWizard.com LLC makes no representations or warranties of any kind, express or implied, as to the operation of this site or to the information, content, materials, or products included on this site. You expressly agree that your use of this site is at your sole risk.
