Despite record unemployment and financially uncertain times, America’s struggle with debt showed signs of improving during the first year of the pandemic. Our team of analysts found that credit card scores improved, more people got caught up on their student loans and the number of people in debt collection has declined over the last year.
Key findings:
- Minnesota, Wisconsin and Idaho had the biggest decreases in debt.
- Debt levels stayed largely the same in Nevada, Texas and Alaska.
- The number of people with a subprime credit score went from 24% to 21%.
- Median debt increased by as much as $120 in some states and nearly $2,500 in certain counties.
- Student loan delinquency decreased by 33% nationwide.
- Credit card delinquency dropped by 31% nationwide.
To get an accurate picture of how debt changed during the beginning of the pandemic, our analysts evaluated five key metrics. We then monitored how these metrics changed over an eight-month period from February 2020 to October 2020.
This article includes:
Debt during the pandemic
We found that Wisconsin had the largest reduction in their amount of debt, while Kansas had the smallest.
When we looked at all of the debt factors mentioned above, we found that Minnesota had the biggest change in their amount of debt and Alaska and Texas had the smallest. In Minnesota, credit card scores improved by three percentage points, the number of people in collections dropped by three percentage points, median debt increased by $27, student loan delinquency declined by 36% and credit card delinquency decreased by 30%.
Compare those numbers to Alaska, which had a two-percentage-point drop in subprime credit scores, a one-percentage-point decrease in debt collection, a $108 increase in median debt, a 24% drop in student loan delinquency and a 27% decrease in credit card delinquency.
| State | Overall rank | Change in credit score rank | Change in debt collection rank | Change in median debt rank | Change in student loan delinquency rank | Change in credit delinquency rank |
|---|---|---|---|---|---|---|
| Minnesota | 1 | -15% | -5% | $27 | -36% | -30% |
| Wisconsin | 2 | -15% | -11% | -$148 | -38% | -31% |
| Idaho | 3 | -11% | -6% | -$45 | -36% | -25% |
| Connecticut | 4 | -12% | -4% | -$79 | -38% | -30% |
| Arizona | 5 | -13% | -5% | $1 | -33% | -32% |
| Michigan | 6 | -12% | -4% | -$51 | -29% | -39% |
| Delaware | 7 | -10% | -2% | -$44 | -38% | -38% |
| Maine | 8 | -11% | -2% | -$3 | -38% | -33% |
| Iowa | 9 | -13% | -5% | $30 | -36% | -33% |
| Colorado | 10 | -12% | -4% | -$45 | -36% | -27% |
| Montana | 11 | -13% | -3% | -$38 | -27% | -26% |
| North Carolina | 12 (tie) | -11% | -4% | -$102 | -31% | -30% |
| Massachusetts | 12 (tie) | -15% | -4% | $35 | -30% | -31% |
| Rhode Island | 14 | -13% | -5% | $9 | -29% | -39% |
| New Jersey | 15 | -13% | -3% | -$7 | -31% | -33% |
| New Mexico | 16 | -12% | -4% | -$37 | -30% | -30% |
| North Dakota | 17 | -8% | -2% | -$244 | -36% | -29% |
| Maryland | 18 | -13% | -4% | $41 | -33% | -35% |
| Nebraska | 19 | -11% | -2% | $92 | -50% | -29% |
| Oregon | 20 | -13% | -5% | $2 | -27% | -28% |
| New York | 21 | -12% | -2% | -$5 | -31% | -33% |
| Washington | 22 | -14% | -5% | $62 | -25% | -30% |
| Virginia | 23 | -11% | -4% | $28 | -36% | -32% |
| Ohio | 24 (tie) | -8% | -1% | -$29 | -35% | -31% |
| Georgia | 24 (tie) | -10% | -2% | $35 | -32% | -34% |
| Missouri | 26 (tie) | -9% | -1% | $73 | -39% | -33% |
| Oklahoma | 26 (tie) | -8% | -4% | $120 | -35% | -27% |
| South Dakota | 28 | -10% | -4% | $11 | -30% | -27% |
| Vermont | 29 | -13% | -3% | $46 | -30% | -35% |
| New Hampshire | 29 | -14% | -3% | $54 | -27% | -30% |
| Kentucky | 31 | -8% | -2% | -$27 | -35% | -31% |
| Indiana | 32 | -9% | -2% | -$16 | -28% | -30% |
| Illinois | 33 (tie) | -10% | -2% | $25 | -29% | -30% |
| Alabama | 33 (tie) | -8% | -2% | $36 | -40% | -34% |
| California | 35 | -12% | -1% | $54 | -33% | -33% |
| Arkansas | 36 (tie) | -7% | -1% | -$8 | -38% | -28% |
| Wyoming | 36 (tie) | -9% | -3% | $31 | -33% | -27% |
| Pennsylvania | 38 | -13% | -3% | $1 | -29% | -36% |
| South Carolina | 39 | -8% | -2% | -$100 | -32% | -31% |
| Hawaii | 40 | -6% | 5% | -$73 | -29% | -33% |
| Louisiana | 41 | -8% | -1% | $35 | -35% | -33% |
| Florida | 42 | -8% | 0% | $39 | -33% | -29% |
| Kansas | 43 | -7% | -2% | $5 | -31% | -25% |
| Mississippi | 44 | -10% | -1% | $71 | -32% | -29% |
| West Virginia | 45 | -7% | 0% | -$62 | -35% | -28% |
| Tennessee | 46 | -8% | -2% | $12 | -28% | -30% |
| Utah | 47 | -11% | -2% | $75 | -25% | -25% |
| Nevada | 48 | -10% | -2% | $83 | -29% | -30% |
| Texas | 49 (tie) | -7% | 0% | $61 | -35% | -30% |
| Alaska | 49 (tie) | -7% | -1% | $108 | -24% | -27% |
Credit card scores
Having a good credit score can affect everything from home mortgages and credit cards to what you pay for insurance and cell phones. We found that the number of people with subprime credit scores dropped by 3% nationwide during the first year of the pandemic. Mississippi and Maryland had the highest decreases in subprime scores. Vermont and Minnesota have the fewest residents with subprime scores.
| State | % of people with a subprime credit score in February 2020 | % of people with a subprime credit score in October 2020 |
|---|---|---|
| Alabama | 33% | 30% |
| Alaska | 25% | 23% |
| Arizona | 26% | 23% |
| Arkansas | 32% | 30% |
| California | 20% | 18% |
| Colorado | 20% | 18% |
| Connecticut | 21% | 18% |
| Delaware | 26% | 23% |
| Florida | 26% | 24% |
| Georgia | 32% | 29% |
| Hawaii | 16% | 15% |
| Idaho | 19% | 17% |
| Illinois | 23% | 21% |
| Indiana | 27% | 24% |
| Iowa | 19% | 17% |
| Kansas | 23% | 21% |
| Kentucky | 29% | 27% |
| Louisiana | 35% | 32% |
| Maine | 21% | 19% |
| Maryland | 25% | 21% |
| Massachusetts | 17% | 14% |
| Michigan | 24% | 21% |
| Minnesota | 14% | 11% |
| Mississippi | 36% | 32% |
| Missouri | 26% | 24% |
| Montana | 19% | 17% |
| Nebraska | 18% | 16% |
| Nevada | 30% | 27% |
| New Hampshire | 16% | 14% |
| New Jersey | 21% | 18% |
| New Mexico | 29% | 26% |
| New York | 20% | 17% |
| North Carolina | 28% | 25% |
| North Dakota | 16% | 15% |
| Ohio | 26% | 24% |
| Oklahoma | 32% | 29% |
| Oregon | 18% | 15% |
| Pennsylvania | 22% | 19% |
| Rhode Island | 22% | 19% |
| South Carolina | 32% | 29% |
| South Dakota | 15% | 14% |
| Tennessee | 29% | 27% |
| Texas | 32% | 29% |
| Utah | 19% | 17% |
| Vermont | 15% | 13% |
| Virginia | 24% | 21% |
| Washington | 16% | 14% |
| West Virginia | 31% | 29% |
| Wisconsin | 19% | 16% |
| Wyoming | 22% | 20% |
Median debt in collections
While the number of people with subprime credit scores dropped significantly nationwide, the number of people with debt in collections did not: Our team found a 1% drop in the number of people facing collections. Wisconsin’s three-percentage-point drop was the largest change in the amount of people facing collections; however, 19 states reported no change.
| State | % of people with debt in collections - February 2020 | % of people with debt in collections - October 2020 |
|---|---|---|
| Alabama | 38% | 37% |
| Alaska | 27% | 26% |
| Arizona | 32% | 30% |
| Arkansas | 37% | 37% |
| California | 23% | 23% |
| Colorado | 24% | 23% |
| Connecticut | 25% | 24% |
| Delaware | 31% | 31% |
| Florida | 33% | 33% |
| Georgia | 37% | 36% |
| Hawaii | 18% | 18% |
| Idaho | 22% | 21% |
| Illinois | 28% | 27% |
| Indiana | 31% | 31% |
| Iowa | 23% | 21% |
| Kansas | 27% | 27% |
| Kentucky | 35% | 35% |
| Louisiana | 42% | 41% |
| Maine | 28% | 27% |
| Maryland | 28% | 27% |
| Massachusetts | 19% | 18% |
| Michigan | 29% | 28% |
| Minnesota | 15% | 14% |
| Mississippi | 39% | 39% |
| Missouri | 32% | 32% |
| Montana | 22% | 22% |
| Nebraska | 19% | 19% |
| Nevada | 36% | 35% |
| New Hampshire | 20% | 19% |
| New Jersey | 25% | 24% |
| New Mexico | 36% | 34% |
| New York | 22% | 22% |
| North Carolina | 35% | 34% |
| North Dakota | 17% | 17% |
| Ohio | 32% | 31% |
| Oklahoma | 38% | 37% |
| Oregon | 20% | 19% |
| Pennsylvania | 27% | 26% |
| Rhode Island | 25% | 23% |
| South Carolina | 41% | 40% |
| South Dakota | 17% | 16% |
| Tennessee | 35% | 35% |
| Texas | 40% | 40% |
| Utah | 21% | 21% |
| Vermont | 18% | 18% |
| Virginia | 28% | 27% |
| Washington | 18% | 17% |
| West Virginia | 40% | 40% |
| Wisconsin | 23% | 20% |
| Wyoming | 27% | 26% |
| U.S. average | 28% | 27% |
Changes in median debt
Fewer people had debt in collection by October of 2020, but the amount they owed slightly increased over the first year of the pandemic. Nationwide, the median debt in collections increased by $3; however, the change in median debt varies significantly from state to state. We found that median debt increased by as much as $120 in Oklahoma and decreased by nearly $250 in North Dakota.
| State | median debt in collections - February 2020 | median debt in collections - October 2020 | Change in median debt |
|---|---|---|---|
| Alabama | $1,917 | $1,953 | $36 |
| Alaska | $2,073 | $2,181 | $108 |
| Arizona | $2,051 | $2,052 | $1 |
| Arkansas | $1,671 | $1,663 | -$8 |
| California | $1,842 | $1,896 | $54 |
| Colorado | $1,682 | $1,637 | -$45 |
| Connecticut | $1,625 | $1,546 | -$79 |
| Delaware | $1,891 | $1,847 | -$44 |
| Florida | $2,186 | $2,225 | $39 |
| Georgia | $1,948 | $1,983 | $35 |
| Hawaii | $1,999 | $1,926 | -$73 |
| Idaho | $2,307 | $2,262 | -$45 |
| Illinois | $1,547 | $1,572 | $25 |
| Indiana | $1,872 | $1,856 | -$16 |
| Iowa | $1,647 | $1,677 | $30 |
| Kansas | $1,746 | $1,751 | $5 |
| Kentucky | $1,342 | $1,315 | -$27 |
| Louisiana | $1,899 | $1,934 | $35 |
| Maine | $1,694 | $1,691 | -$3 |
| Maryland | $1,569 | $1,610 | $41 |
| Massachusetts | $1,549 | $1,584 | $35 |
| Michigan | $1,553 | $1,502 | -$51 |
| Minnesota | $1,700 | $1,727 | $27 |
| Mississippi | $1,774 | $1,845 | $71 |
| Missouri | $1,948 | $2,021 | $73 |
| Montana | $1,837 | $1,799 | -$38 |
| Nebraska | $2,003 | $2,095 | $92 |
| Nevada | $2,132 | $2,215 | $83 |
| New Hampshire | $1,674 | $1,728 | $54 |
| New Jersey | $1,379 | $1,372 | -$7 |
| New Mexico | $1,761 | $1,724 | -$37 |
| New York | $1,755 | $1,750 | -$5 |
| North Carolina | $1,670 | $1,568 | -$102 |
| North Dakota | $2,158 | $1,914 | -$244 |
| Ohio | $1,529 | $1,500 | -$29 |
| Oklahoma | $2,122 | $2,242 | $120 |
| Oregon | $1,540 | $1,542 | $2 |
| Pennsylvania | $1,821 | $1,822 | $1 |
| Rhode Island | $1,794 | $1,803 | $9 |
| South Carolina | $2,197 | $2,097 | -$100 |
| South Dakota | $2,201 | $2,212 | $11 |
| Tennessee | $1,947 | $1,959 | $12 |
| Texas | $2,102 | $2,163 | $61 |
| Utah | $1,891 | $1,966 | $75 |
| Vermont | $1,702 | $1,748 | $46 |
| Virginia | $1,776 | $1,804 | $28 |
| Washington | $1,794 | $1,856 | $62 |
| West Virginia | $1,643 | $1,581 | -$62 |
| Wisconsin | $1,854 | $1,706 | -$148 |
| Wyoming | $2,478 | $2,509 | $31 |
| U.S. average | $1,836 | $1,839 | $3 |
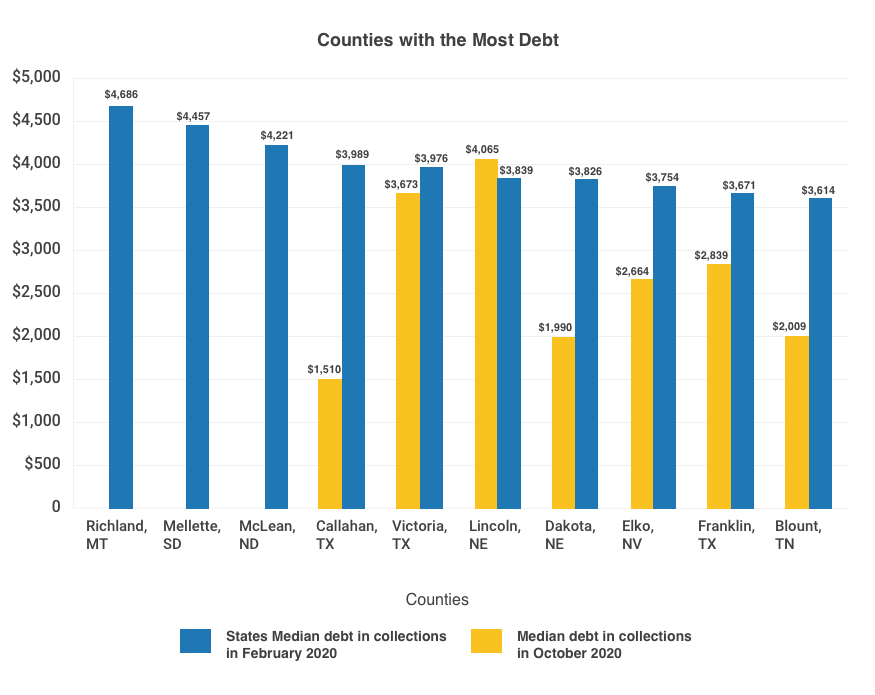
When our analysts looked at the debt picture in over 3,000 counties, we found even more drastic changes. Median debt in parts of Montana, South Dakota, North Dakota and Texas is nearly $4,000 or more. And we found 10 counties where median debt increased by as much as 160% in just eight months.
| County | Median debt - February 2020 | Median debt - October 2020 | % change in debt |
|---|---|---|---|
| Callahan, TX | $1,510 | $3,989 | 164% |
| Lee, NC | $1,201 | $3,128 | 160% |
| Crook, OR | $578 | $1,333 | 131% |
| Oglethorpe, GA | $834 | $1,912 | 129% |
| Jefferson, MS | $1,463 | $3,216 | 120% |
| Kingfisher, OK | $810 | $1,765 | 118% |
| Transylvania, NC | $886 | $1,922 | 117% |
| Mayes, OK | $1,676 | $3,503 | 109% |
| Dade, GA | $1,712 | $3,547 | 107% |
| Socorro, NM | $1,004 | $2,066 | 106% |
Student loan delinquency
Student loan delinquency rates underwent a major change during the pandemic. We found that nationwide, the number of people who are delinquent on their student loans dropped by 33%. Student loan delinquency dropped by 50% in Nebraska, 40% in Alabama and 25% or less in Utah and Alaska.
| State | % of people delinquent on their student loans - February 2020 | % of people delinquent on the student loans - October 2020 | Change in student loan delinquency |
|---|---|---|---|
| Alabama | 20% | 12% | -40% |
| Alaska | 17% | 13% | -24% |
| Arizona | 18% | 12% | -33% |
| Arkansas | 21% | 13% | -38% |
| California | 15% | 10% | -33% |
| Colorado | 14% | 9% | -36% |
| Connecticut | 13% | 8% | -38% |
| Delaware | 16% | 10% | -38% |
| Florida | 18% | 12% | -33% |
| Georgia | 19% | 13% | -32% |
| Hawaii | 14% | 10% | -29% |
| Idaho | 14% | 9% | -36% |
| Illinois | 14% | 10% | -29% |
| Indiana | 18% | 13% | -28% |
| Iowa | 14% | 9% | -36% |
| Kansas | 16% | 11% | -31% |
| Kentucky | 20% | 13% | -35% |
| Louisiana | 20% | 13% | -35% |
| Maine | 13% | 8% | -38% |
| Maryland | 15% | 10% | -33% |
| Massachusetts | 10% | 7% | -30% |
| Michigan | 17% | 12% | -29% |
| Minnesota | 11% | 7% | -36% |
| Mississippi | 22% | 15% | -32% |
| Missouri | 18% | 11% | -39% |
| Montana | 15% | 11% | -27% |
| Nebraska | 12% | 6% | -50% |
| Nevada | 21% | 15% | -29% |
| New Hampshire | 11% | 8% | -27% |
| New Jersey | 13% | 9% | -31% |
| New Mexico | 20% | 14% | -30% |
| New York | 13% | 9% | -31% |
| North Carolina | 16% | 11% | -31% |
| North Dakota | 11% | 7% | -36% |
| Ohio | 17% | 11% | -35% |
| Oklahoma | 23% | 15% | -35% |
| Oregon | 15% | 11% | -27% |
| Pennsylvania | 14% | 10% | -29% |
| Rhode Island | 14% | 10% | -29% |
| South Carolina | 19% | 13% | -32% |
| South Dakota | 10% | 7% | -30% |
| Tennessee | 18% | 13% | -28% |
| Texas | 17% | 11% | -35% |
| Utah | 12% | 9% | -25% |
| Vermont | 10% | 7% | -30% |
| Virginia | 14% | 9% | -36% |
| Washington | 12% | 9% | -25% |
| West Virginia | 20% | 13% | -35% |
| Wisconsin | 13% | 8% | -38% |
| Wyoming | 12% | 8% | -33% |
| U.S. average | 16% | 10% | -33% |
Credit card delinquency
The biggest change in regards to debt during the pandemic happened in credit card delinquency rates. Our analysts found that credit delinquency declined by 31% nationwide and by nearly 40% in Michigan, Delaware and Rhode Island.
| State | % of people delinquent on their credit cards in February 2020 | % of people delinquent on the credit cards in October 2020 | Change in credit card delinquency |
|---|---|---|---|
| Alabama | 8% | 5% | -34% |
| Alaska | 5% | 4% | -27% |
| Arizona | 6% | 4% | -32% |
| Arkansas | 8% | 6% | -28% |
| California | 5% | 4% | -33% |
| Colorado | 5% | 3% | -27% |
| Connecticut | 5% | 4% | -30% |
| Delaware | 6% | 4% | -38% |
| Florida | 7% | 5% | -29% |
| Georgia | 8% | 6% | -34% |
| Hawaii | 5% | 3% | -33% |
| Idaho | 4% | 3% | -25% |
| Illinois | 5% | 4% | -30% |
| Indiana | 6% | 4% | -30% |
| Iowa | 5% | 3% | -33% |
| Kansas | 5% | 3% | -25% |
| Kentucky | 7% | 5% | -31% |
| Louisiana | 8% | 5% | -33% |
| Maine | 5% | 3% | -33% |
| Maryland | 7% | 4% | -35% |
| Massachusetts | 5% | 3% | -31% |
| Michigan | 6% | 3% | -39% |
| Minnesota | 4% | 3% | -30% |
| Mississippi | 6% | 4% | -29% |
| Missouri | 10% | 7% | -33% |
| Montana | 4% | 3% | -26% |
| Nebraska | 5% | 3% | -29% |
| Nevada | 8% | 5% | -30% |
| New Hampshire | 5% | 3% | -30% |
| New Jersey | 6% | 4% | -33% |
| New Mexico | 6% | 4% | -30% |
| New York | 6% | 4% | -33% |
| North Carolina | 7% | 5% | -30% |
| North Dakota | 4% | 3% | -29% |
| Ohio | 6% | 4% | -31% |
| Oklahoma | 6% | 5% | -27% |
| Oregon | 4% | 3% | -28% |
| Pennsylvania | 6% | 4% | -36% |
| Rhode Island | 6% | 4% | -39% |
| South Carolina | 7% | 5% | -31% |
| South Dakota | 4% | 3% | -27% |
| Tennessee | 6% | 4% | -30% |
| Texas | 7% | 5% | -30% |
| Utah | 4% | 3% | -25% |
| Vermont | 4% | 3% | -35% |
| Virginia | 5% | 4% | -32% |
| Washington | 4% | 3% | -30% |
| West Virginia | 7% | 5% | -28% |
| Wisconsin | 4% | 3% | -31% |
| Wyoming | 5% | 3% | -27% |
| U.S. average | 6% | 4% | -31% |
Debt and demographics
People of color have been disproportionately affected by the ongoing pandemic. And that includes changes in debt. Before the pandemic started, people of color had a higher rate of subprime credit scores, more debt in collections and a higher rate of student loan delinquencies than majority-white communities.
We found that while those debt indicators changed for people of color during the pandemic, they did not always change as much as in white communities. For example, Black communities had a 9% decrease in subprime credit scores and a 2% decrease in collections during the first year of the pandemic. White communities, meanwhile, had an 11% and 3% change, respectively. Native American communities experienced one of the biggest changes. The number of people with debt in collections dropped by 4% in Native communities and median debt dropped by more than $200.
We believe there are several main reasons why debt changed so much during the pandemic. One, lockdowns kept people at home. And with less money to spend on travel and entertainment expenses, Americans simply saved more. Two, the first round of stimulus payments was issued in March 2020. This put an extra $1,200 or more in people’s pockets that they could use for expenses or to pay off student loans. Finally, the United States experienced unprecedented job losses at the beginning of the pandemic. So, while the employed had extra money to pay off their debts, those who lost their jobs fell deeper into debt, leading to an increase in the median debt in collections.
Methodology
Changes in subprime credit scores, median debt in collections, median debt and student loan delinquency were calculated using data from the Urban Institute. To calculate changes, QuoteWizard looked at 33 different debt indicators for all 50 states and 3,138 counties every two months from February 2020 to October 2020. We then compared those changes across each debt indicator for each state and location.
Subprime credit score is defined as a credit score of 580-619.
Student loan delinquency is defined as not making a student loan payment for 60 days.
Credit card delinquency is defined as not making a credit card payment for 30 days.
References:
QuoteWizard.com LLC has made every effort to ensure that the information on this site is correct, but we cannot guarantee that it is free of inaccuracies, errors, or omissions. All content and services provided on or through this site are provided "as is" and "as available" for use. QuoteWizard.com LLC makes no representations or warranties of any kind, express or implied, as to the operation of this site or to the information, content, materials, or products included on this site. You expressly agree that your use of this site is at your sole risk.