It’s been nearly a year and a half since the first cases of COVID-19 led to lockdowns, travel warnings and stay-at-home orders. Those social distancing measures have mainly been lifted, but we found many people are still staying home. And it’s had a direct impact on coronavirus cases in their state.
Key findings:
- States that are staying home have lower numbers of coronavirus cases.
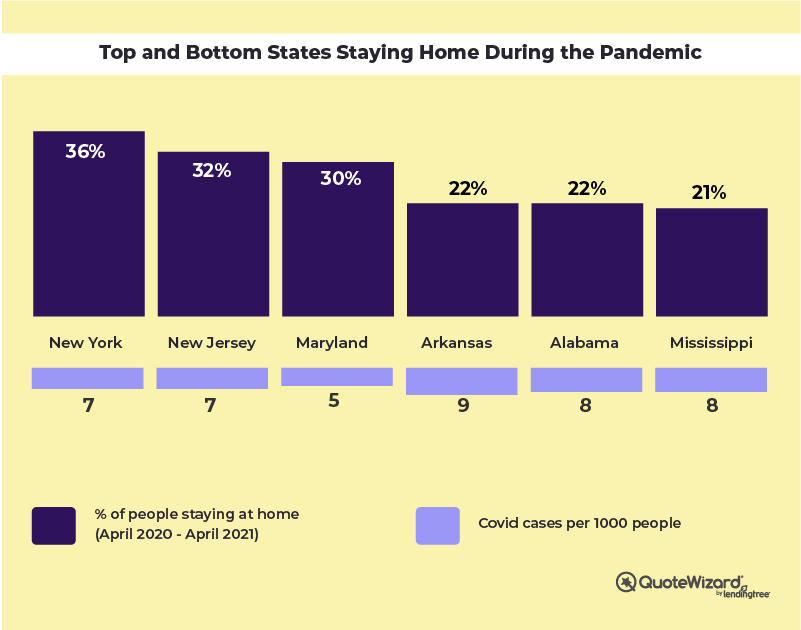
- New York, New Jersey, Maryland and Massachusetts have stayed home the most over the last year.
- Alabama, Mississippi and Arkansas have stayed home the least over the last year.
Our team of analysts at QuoteWizard looked at mobility numbers from the Bureau of Transportation Statistics and the University of Maryland. We found that states that have a higher percentage of people staying home frequently have a lower number of coronavirus cases per capita.

| State | % of people staying home | COVID-19 cases per 1000 people |
|---|---|---|
| New York | 36% | 7 |
| New Jersey | 32% | 7 |
| Maryland | 30% | 5 |
| Massachusetts | 30% | 7 |
| California | 29% | 7 |
| Connecticut | 28% | 6 |
| Illinois | 28% | 8 |
| Nevada | 28% | 8 |
| Oregon | 28% | 3 |
| Pennsylvania | 28% | 6 |
| Virginia | 28% | 4 |
| Washington | 28% | 6 |
| Colorado | 27% | 6 |
| Delaware | 27% | 7 |
| Rhode Island | 27% | 9 |
| Arizona | 26% | 9 |
| Hawaii | 26% | 2 |
| Kansas | 26% | 8 |
| Michigan | 26% | 5 |
| Minnesota | 26% | 7 |
| Alaska | 25% | 6 |
| Florida | 25% | 7 |
| Louisiana | 25% | 8 |
| Missouri | 25% | 7 |
| Montana | 25% | 8 |
| Nebraska | 25% | 8 |
| New Mexico | 25% | 7 |
| Ohio | 25% | 7 |
| Texas | 25% | 7 |
| Utah | 25% | 2 |
| West Virginia | 25% | 8 |
| Georgia | 24% | 7 |
| Indiana | 24% | 8 |
| Iowa | 24% | 9 |
| Kentucky | 24% | 7 |
| North Carolina | 24% | 7 |
| Vermont | 24% | 6 |
| Wisconsin | 24% | 8 |
| Wyoming | 24% | 8 |
| Idaho | 23% | 8 |
| Maine | 23% | 3 |
| New Hampshire | 23% | 5 |
| North Dakota | 23% | 11 |
| Oklahoma | 23% | 9 |
| South Carolina | 23% | 8 |
| South Dakota | 23% | 10 |
| Tennessee | 23% | 9 |
| Alabama | 22% | 8 |
| Arkansas | 22% | 9 |
| Mississippi | 21% | 8 |
How often are people driving to work?
When people did leave home, however, it wasn’t usually to go to work. We found that on average, only three of the 24 trips people took each week were to work.
Colorado, Massachusetts, and Wyoming took the most trips overall. Nebraska, North Dakota and Wyoming took the most work trips with four a week.. Arizona, Connecticut, Michigan and Nevada took the fewest work trips with two a week. And finally, Massachusetts, Colorado and Utah took the highest numbers of non-work trips with around 24 outings a week.
| State | Average trips per week | Work trips per week | Non-work trips per week |
|---|---|---|---|
| Alabama | 22 | 3 | 19 |
| Alaska | 23 | 3 | 20 |
| Arizona | 21 | 2 | 19 |
| Arkansas | 22 | 3 | 19 |
| California | 22 | 3 | 19 |
| Colorado | 27 | 3 | 24 |
| Connecticut | 23 | 2 | 21 |
| Delaware | 22 | 3 | 19 |
| Florida | 21 | 3 | 19 |
| Georgia | 22 | 3 | 19 |
| Hawaii | 21 | 3 | 18 |
| Idaho | 23 | 3 | 20 |
| Illinois | 26 | 4 | 22 |
| Indiana | 25 | 3 | 22 |
| Iowa | 26 | 3 | 22 |
| Kansas | 25 | 3 | 22 |
| Kentucky | 25 | 3 | 22 |
| Louisiana | 25 | 3 | 22 |
| Maine | 23 | 3 | 20 |
| Maryland | 22 | 2 | 20 |
| Massachusetts | 27 | 3 | 24 |
| Michigan | 23 | 2 | 21 |
| Minnesota | 24 | 3 | 21 |
| Mississippi | 22 | 3 | 19 |
| Missouri | 24 | 3 | 21 |
| Montana | 23 | 3 | 19 |
| Nebraska | 25 | 4 | 22 |
| Nevada | 22 | 2 | 19 |
| New Hampshire | 24 | 3 | 21 |
| New Jersey | 24 | 3 | 21 |
| New Mexico | 26 | 3 | 23 |
| New York | 26 | 4 | 22 |
| North Carolina | 23 | 3 | 20 |
| North Dakota | 24 | 4 | 20 |
| Ohio | 24 | 3 | 21 |
| Oklahoma | 24 | 4 | 20 |
| Oregon | 24 | 3 | 21 |
| Pennsylvania | 23 | 3 | 20 |
| Rhode Island | 23 | 3 | 21 |
| South Carolina | 23 | 3 | 20 |
| South Dakota | 25 | 3 | 22 |
| Tennessee | 24 | 3 | 21 |
| Texas | 22 | 3 | 19 |
| Utah | 26 | 3 | 24 |
| Vermont | 24 | 3 | 21 |
| Virginia | 23 | 3 | 20 |
| Washington | 23 | 3 | 20 |
| West Virginia | 22 | 3 | 20 |
| Wisconsin | 25 | 3 | 21 |
| Wyoming | 27 | 4 | 23 |
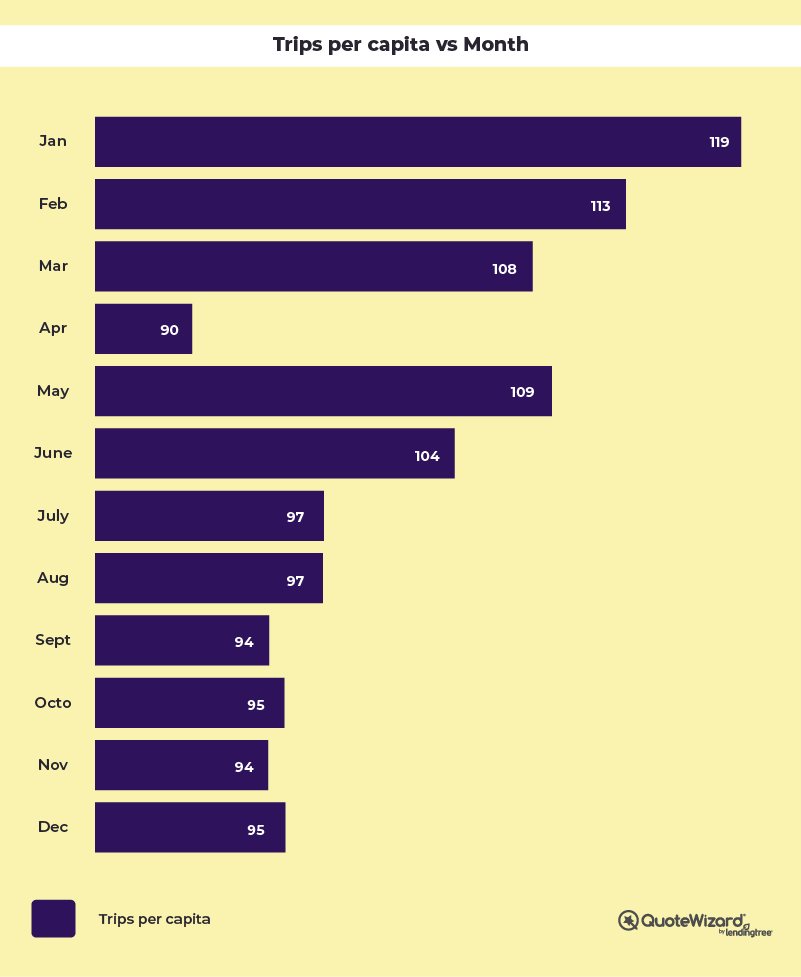
A pattern emerged when QuoteWizard analysts tracked nationwide travel data by month. We found that travel was highly dependent on lockdowns, stay-at-home orders and COVID-19-related news.
Trips per capita began to fall shortly after the first U.S. coronavirus case was confirmed on January 19, 2020. However, travel remained relatively high until a series of statewide stay-at-home orders were issued in late March and early April. In May 2020, many states began phased reopening plans. This led to a dramatic increase in the number of people traveling. The increase in travel continued into June when several COVID-19-related milestones were passed.
In May 2020, many states began phased reopening plans. This led to a dramatic increase in the number of people traveling. The increase in travel continued into June when several COVID-19-related milestones were passed.

States that drive the most
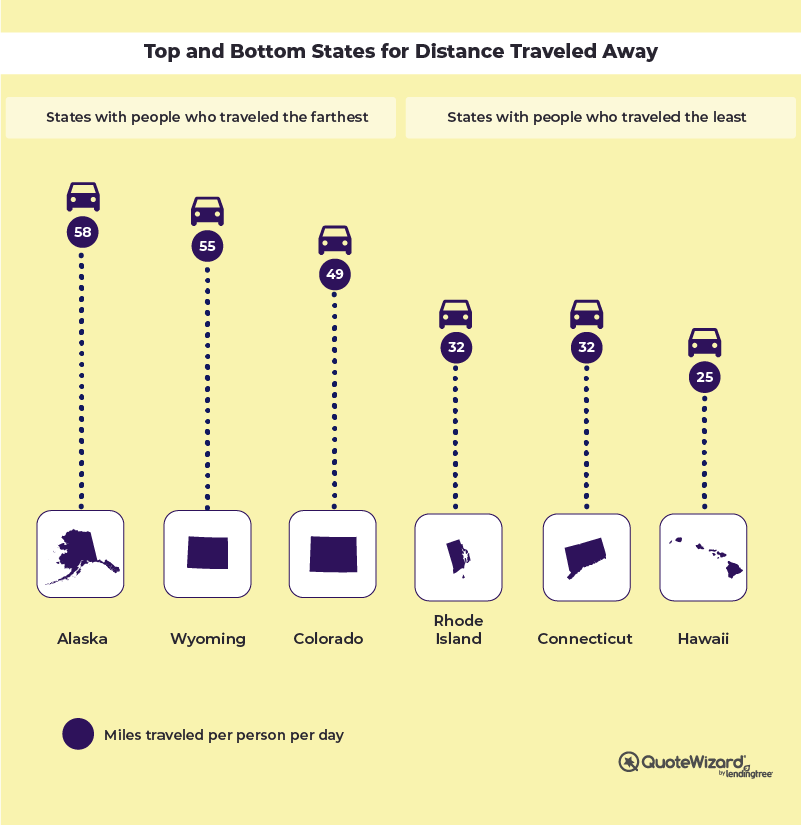
When people decided to leave home, they usually didn’t go too far. We found that the average person traveled 40 miles a day, left their home county on 29% of trips and left the state only 6% of the time.

Alaska and Wyoming drove the farthest, while Virginia drivers went outside their county the most and New Hampshire drivers took the most out-of-state trips.
| State | Miles per person per day | % of total trips that are outside the county | % of total trips that are outside the state |
|---|---|---|---|
| Alabama | 38 | 29% | 5% |
| Alaska | 58 | 7% | 1% |
| Arizona | 39 | 11% | 2% |
| Arkansas | 39 | 29% | 6% |
| California | 37 | 17% | 1% |
| Colorado | 49 | 35% | 2% |
| Connecticut | 32 | 27% | 7% |
| Delaware | 33 | 25% | 17% |
| Florida | 33 | 21% | 1% |
| Georgia | 40 | 38% | 4% |
| Hawaii | 25 | 1% | 0% |
| Idaho | 40 | 28% | 7% |
| Illinois | 46 | 28% | 5% |
| Indiana | 42 | 34% | 7% |
| Iowa | 46 | 33% | 7% |
| Kansas | 44 | 29% | 8% |
| Kentucky | 43 | 35% | 8% |
| Louisiana | 41 | 31% | 3% |
| Maine | 37 | 27% | 5% |
| Maryland | 34 | 35% | 11% |
| Massachusetts | 39 | 31% | 7% |
| Michigan | 40 | 29% | 2% |
| Minnesota | 48 | 36% | 4% |
| Mississippi | 39 | 34% | 7% |
| Missouri | 43 | 34% | 7% |
| Montana | 45 | 18% | 3% |
| Nebraska | 44 | 31% | 6% |
| Nevada | 39 | 10% | 4% |
| New Hampshire | 42 | 37% | 18% |
| New Jersey | 36 | 36% | 8% |
| New Mexico | 45 | 22% | 6% |
| New York | 39 | 29% | 4% |
| North Carolina | 39 | 31% | 4% |
| North Dakota | 46 | 27% | 9% |
| Ohio | 37 | 32% | 4% |
| Oklahoma | 41 | 31% | 4% |
| Oregon | 37 | 27% | 5% |
| Pennsylvania | 35 | 30% | 6% |
| Rhode Island | 32 | 34% | 17% |
| South Carolina | 35 | 31% | 7% |
| South Dakota | 44 | 33% | 6% |
| Tennessee | 42 | 31% | 7% |
| Texas | 38 | 25% | 1% |
| Utah | 48 | 23% | 3% |
| Vermont | 35 | 31% | 12% |
| Virginia | 37 | 43% | 6% |
| Washington | 38 | 21% | 4% |
| West Virginia | 37 | 35% | 15% |
| Wisconsin | 46 | 32% | 5% |
| Wyoming | 55 | 20% | 9% |
Methodology:
To find which states saw the largest increases in people staying at home through the pandemic, QuoteWizard analyzed the U.S. Department of Transportation Statistics on Trips by Distance and data from The University of Massachusetts. Through new mobility statistics, we compiled and analyzed data on the number of people staying home month-by-month on a per capita basis.
To represent how stay-at-home orders and seasonality affected travel among Americans, we looked at the month-to-month percentage differences in mobility data. States that ranked closer to 1 (best) saw a larger increase in the rate of people staying home. States that saw a decline or lower rate increase ranked closer to 50 (worst). The data is represented as a per capita number to show the number of occasions each person stayed home per state at any given time.
Associated is the total number of COVID-19 cases per month from April 2020 to April 2021 to show how the correlation between stay-at-home orders/lockdowns and seasonality affects the number of people staying home.
Data was collected by aggregating national, state, and county movement data from mobile devices that includes trips defined as movements that include a stay of longer than 10 minutes at an anonymized location away from home. Home locations were updated weekly, and movement with multiple stays of longer than 10 minutes before returning home can be double counted as multiple trips. The travel medium includes all modes of transportation such as driving a vehicle, riding a train, taking public transit, and via an airplane. No personally identifiable data or information was collected in the process by either the BTS or QuoteWizard.
References:
QuoteWizard.com LLC has made every effort to ensure that the information on this site is correct, but we cannot guarantee that it is free of inaccuracies, errors, or omissions. All content and services provided on or through this site are provided "as is" and "as available" for use. QuoteWizard.com LLC makes no representations or warranties of any kind, express or implied, as to the operation of this site or to the information, content, materials, or products included on this site. You expressly agree that your use of this site is at your sole risk.