For motorcycle riders, America’s roads have never been deadlier. According to the most recent data, there were 5,636 motorcycle fatalities in 2021 — the highest number ever recorded. Each year, the number of fatalities seems to rise.
Key findings
- Texas, Arkansas and Missouri have the highest rates of motorcycle fatalities.
- Motorcycle fatalities are up 22% over the last decade.
- Helmet usage declined from 71% to 68% nationwide from 2020 to 2021.
- Alcohol was involved in 36% of motorcycle fatalities in 2021.
To find the most dangerous states for motorcycle riders, our analysts looked at motorcycle fatalities going back over the last decade. We found that motorcycle fatalities are heavily influenced by three factors: alcohol, climate and helmet use.
Most dangerous states for motorcycle riders
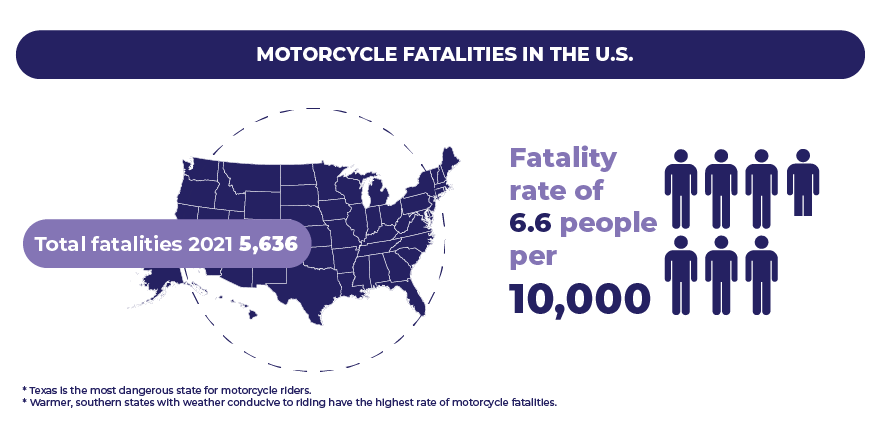
Climate plays an important role when looking at the most dangerous states for motorcycle riders. We found that warmer, southern states with weather conducive to riding have the highest rates of motorcycle fatalities. Texas is the most dangerous state for motorcycle riders. But Arkansas, Missouri and South Carolina all have nearly four times the fatality rates of northern states like New Hampshire, North Dakota and Alaska.
Some of the most alarming data was the increase in fatalities over the last year. Nationally, this figure was low, at only a 1% increase. However, Hawaii saw a 78% increase and Vermont a 50% increase from 2020 to 2021.
| State | Motorcycle fatalities in 2021 | % change in fatalities from 2020 | Deaths per 10K motorcycles |
|---|---|---|---|
| Texas | 496 | 3% | 13.0 |
| Arkansas | 93 | 16% | 12.8 |
| Missouri | 151 | 23% | 11.9 |
| South Carolina | 167 | 22% | 11.2 |
| Nevada | 84 | 45% | 10.1 |
| Louisiana | 81 | 4% | 10.1 |
| Florida | 612 | 2% | 9.5 |
| Hawaii | 32 | 78% | 9.2 |
| Tennessee | 156 | 3% | 9.0 |
| North Carolina | 212 | 10% | 8.5 |
| Delaware | 22 | 47% | 8.2 |
Alcohol use and motorcycle fatalities
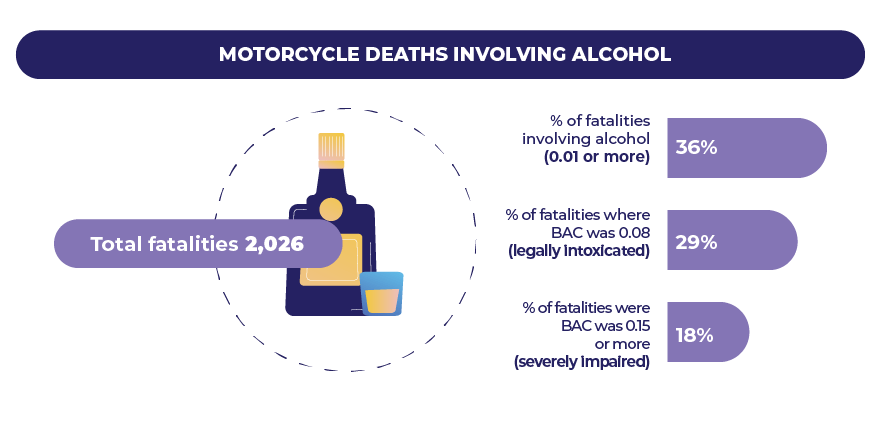
Alcohol was involved in 36% of motorcycle fatalities in 2021. In some cases, the person killed was below the legal limit. However, 29% of fatalities involved someone legally intoxicated, and in 18% of cases, the person killed had a blood alcohol content (BAC) level nearly twice the legal limit.
Our analysts found alcohol use while riding was especially prevalent in certain states. Alcohol was involved in nearly 50% of fatal crashes in West Virginia, Iowa and Hawaii. Alaska, Idaho and Rhode Island had the highest numbers of fatal crashes where someone was severely intoxicated.
| State | % of fatalities with BAC 0.01 or higher | % of fatalities with BAC 0.08 or higher (legally impaired) | % of fatalities with BAC 0.15 or higher (severely impaired) |
|---|---|---|---|
| West Virginia | 50% | 39% | 22% |
| Iowa | 47% | 35% | 19% |
| Hawaii | 46% | 29% | 18% |
| Rhode Island | 46% | 38% | 31% |
| Connecticut | 45% | 32% | 21% |
| Ohio | 45% | 35% | 23% |
| Louisiana | 44% | 33% | 21% |
| New Hampshire | 44% | 39% | 24% |
| Colorado | 43% | 33% | 22% |
| Maine | 43% | 27% | 18% |
| Montana | 43% | 38% | 17% |
Motorcycle helmet laws
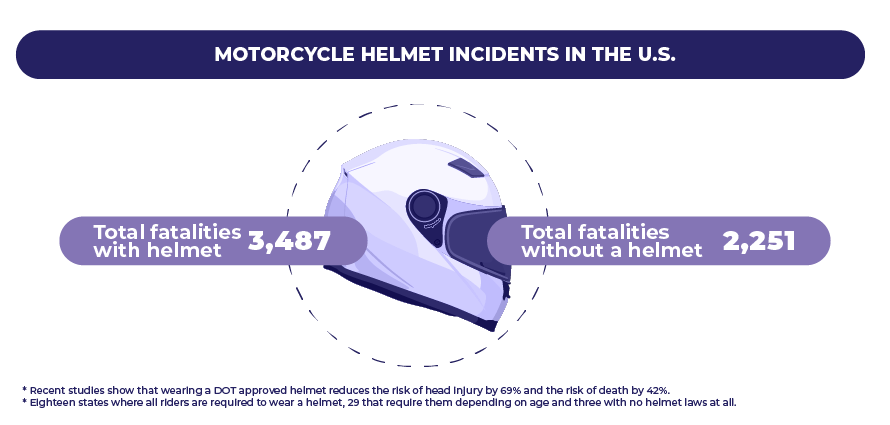
Wearing helmets saves lives. Recent studies show that wearing a DOT-approved helmet reduces the risk of head injury by 69% and the risk of death by 42%. Despite these facts, many states don’t require helmets, and helmet use has declined by four percentage points nationwide.
What’s especially concerning is that helmet use is steadily declining in areas with the highest number of fatalities. We also found that riders are significantly less likely to wear a helmet when they have a passenger.
| Category | Helmet use in 2020 | Helmet use in 2021 | percentage point change 2020-2021 |
|---|---|---|---|
| Riders | 69% | 67% | -2 |
| Passengers | 72% | 52% | -20 |
| Solo | 69% | 70% | 1 |
| Rider and passenger | 65% | 52% | -13 |
| Category | Helmet use in 2020 | Helmet use in 2021 | percentage point change 2020-2021 |
|---|---|---|---|
| Northeast | 77% | 70% | -7 |
| Midwest | 53% | 45% | -9 |
| South | 70% | 71% | 1 |
| West | 85% | 88% | 3 |
| Urban | 67% | 65% | –2 |
| Rural | 71% | 65% | -6 |
Motorcycle helmet laws vary from state to state. We found 18 states where all riders are required to wear a helmet, 29 that require them depending on age and three with no helmet laws at all.
| State | # of deaths where rider was wearing a helmet | # of deaths where rider wasn't wearing a helmet | Helmet law |
|---|---|---|---|
| Alabama | 62 | 12 | all riders |
| Alaska | 4 | 2 | 17 and younger |
| Arizona | 72 | 70 | 17 and younger |
| Arkansas | 41 | 53 | 20 and younger |
| California | 516 | 37 | all riders |
| Colorado | 48 | 84 | 17 and younger |
| Connecticut | 25 | 35 | 17 and younger |
| Delaware | 19 | 4 | 18 and younger |
| Florida | 314 | 328 | 20 and younger |
| Georgia | 165 | 14 | all riders |
| Hawaii | 12 | 21 | 17 and younger |
| *Nebraska is implementing a new helmet law: 20 and younger, effective in 2024. | |||
Riding a motorcycle is inherently more dangerous than most other forms of transportation. But that doesn’t mean it should be needlessly dangerous. Alcohol is involved in an alarming number of fatal crashes, and helmet use is declining in places where it should be increasing. There’s an old story about why you’ll never see a motorcycle parked outside of a psychiatrist's office that only motorcycle riders will understand. Riding is fun, freeing and relaxing. Let’s put on the helmet, put down the beer and ride safely.
Methodology
Motorcycle fatalities were calculated using NHTSA traffic safety statistics from 2020 and 2021. The fatality rate was calculated using 2021 fatality numbers per 10,000 registered motorcycles. The number of alcohol-related motorcycle fatalities was calculated using 2021 NHTSA data. Legally intoxicated is defined as having a BAC level of 0.08%. Severely impaired is defined as having a BAC level of 0.15% or more.
Additionally, the number of fatalities where the rider was not wearing a helmet was compared to the number of deaths without a helmet. This was paired with helmet laws per state from the Insurance Institute for Highway Safety (IIHS).
QuoteWizard.com LLC has made every effort to ensure that the information on this site is correct, but we cannot guarantee that it is free of inaccuracies, errors, or omissions. All content and services provided on or through this site are provided "as is" and "as available" for use. QuoteWizard.com LLC makes no representations or warranties of any kind, express or implied, as to the operation of this site or to the information, content, materials, or products included on this site. You expressly agree that your use of this site is at your sole risk.