
Across America, the roads remain dangerous. Over the past five years, traffic fatalities have increased by 13%. Some years have seen bigger increases than others. For instance, fatalities rose 18% between 2019 and 2020, but only 9% between 2020 and 2021. From 2021 to 2022, traffic fatalities recorded no increase.
Our analysts looked at the latest data on fatal crashes and found that the number of traffic fatalities has fallen across almost every metric, especially among people age 15 and younger. Speeding-related incidents and fatal crashes on urban roads have also significantly declined over the past year.
Key findings:
- Traffic fatalities remained flat from 2021 to 2022.
- Connecticut, New Hampshire and Hawaii had the largest increases in fatalities.
- Idaho saw a 19% decrease in traffic fatalities.
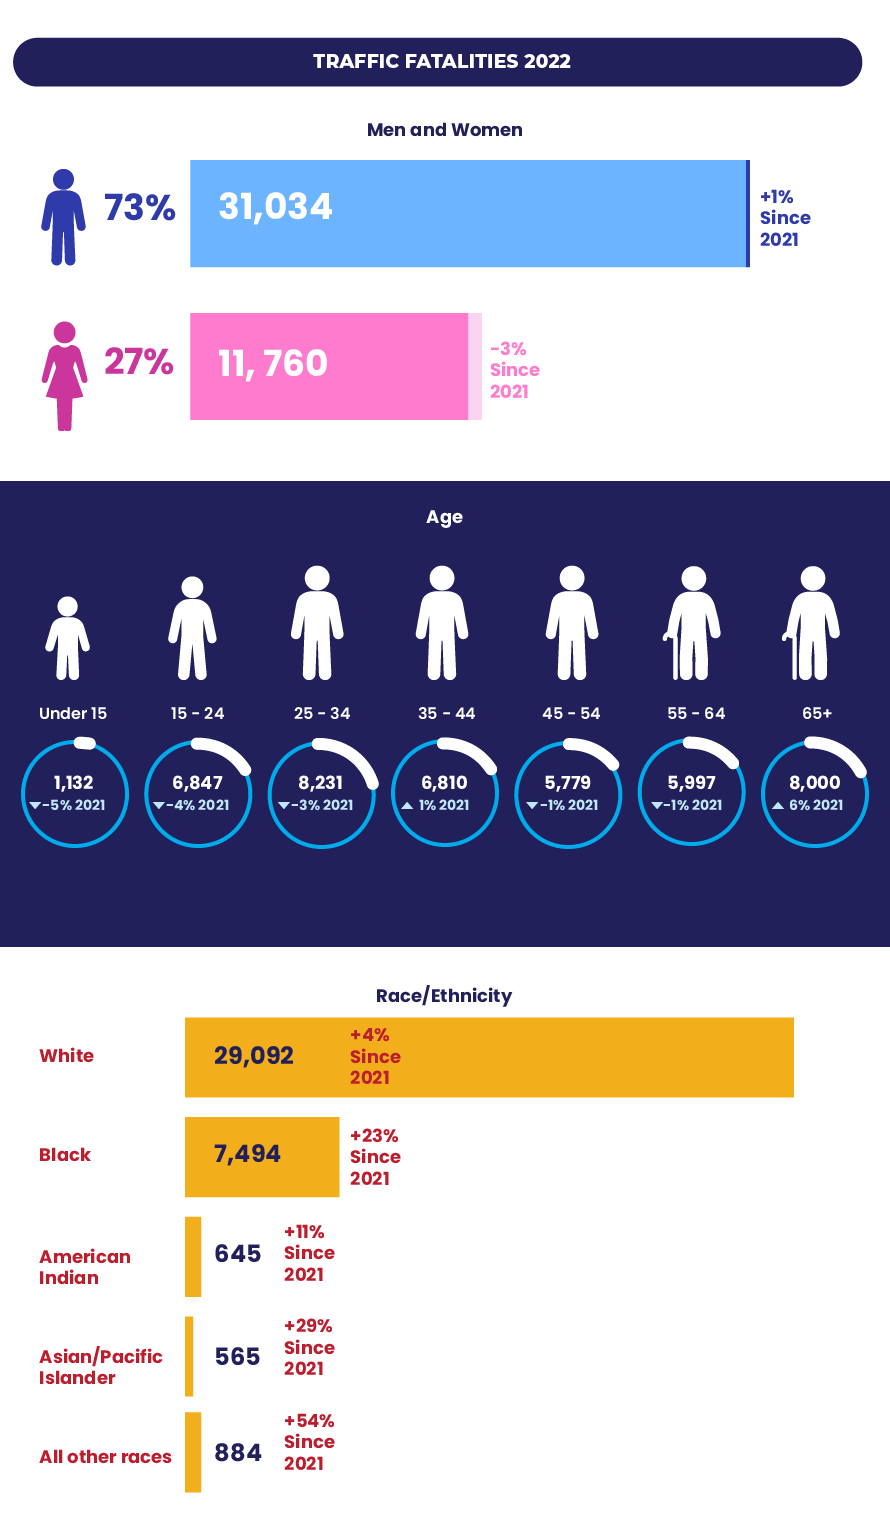
- People age 15 and younger saw the biggest decrease — 5% — in traffic fatalities, while those 65 and older saw a 6% increase.
- Fatalities for pedal cyclists increased by 11%.
- Urban roads became safer, while rural roads became more dangerous.
Traffic fatalities by state
The number of people killed on America’s roads has remained the same since 2021. Although the national average remained unchanged, increases and decreases vary greatly from state to state. Traffic fatalities increased by 10% or more in 13 states and decreased by 10% or more in five states.
Connecticut saw the biggest increase in fatal crashes, rising 29% between 2021 and 2022. Idaho’s traffic fatalities decreased by 19% during the same period. The improvement in Idaho is noteworthy since it ranked as the most dangerous state for traffic fatalities between 2020 and 2021, with a staggering 30% increase.
Overall, these improvements are encouraging, especially after a particularly deadly past few years. Traffic fatalities reached a 13-year high in 2020, when 42,000 people died on America’s roads. Texas, California and Florida have the highest numbers of traffic fatalities overall, but California was the only one of those three which saw an increase (3%).
| State | 2022 | 2021 | % change from 2021 |
|---|---|---|---|
| Connecticut | 384 | 298 | 29% |
| New Hampshire | 148 | 118 | 25% |
| Hawaii | 116 | 94 | 23% |
| Wyoming | 134 | 110 | 22% |
| Alaska | 81 | 67 | 21% |
| Delaware | 164 | 136 | 21% |
| Maine | 183 | 153 | 20% |
| Nebraska | 250 | 221 | 13% |
| Arizona | 1,311 | 1,180 | 11% |
| Washington | 740 | 670 | 10% |
| Colorado | 757 | 691 | 10% |
| Vermont | 77 | 74 | 4% |
| Missouri | 1,058 | 1,016 | 4% |
| Massachusetts | 433 | 417 | 4% |
| Nevada | 396 | 385 | 3% |
| California | 4,407 | 4,285 | 3% |
| Indiana | 955 | 932 | 3% |
| Virginia | 996 | 973 | 2% |
| Oregon | 605 | 599 | 1% |
| Alabama | 989 | 983 | 1% |
| New Jersey | 701 | 699 | 0% |
| Tennessee | 1,330 | 1,327 | 0% |
| North Carolina | 1,667 | 1,663 | 0% |
| Texas | 4,496 | 4,498 | 0% |
| U.S. | 42,795 | 42,939 | 0% |
| Michigan | 1,133 | 1,136 | 0% |
| Georgia | 1,786 | 1,797 | -1% |
| Maryland | 557 | 561 | -1% |
| New York | 1,148 | 1,157 | -1% |
| Utah | 321 | 328 | -2% |
| Kansas | 415 | 424 | -2% |
| Florida | 3,652 | 3,738 | -2% |
| Wisconsin | 602 | 620 | -3% |
| New Mexico | 466 | 481 | -3% |
| Pennsylvania | 1,191 | 1,230 | -3% |
| Illinois | 1,280 | 1,334 | -4% |
| North Dakota | 97 | 101 | -4% |
| Oklahoma** | 730 | 762 | -4% |
| West Virginia | 268 | 280 | -4% |
| Iowa | 339 | 356 | -5% |
| Ohio | 1,278 | 1,354 | -6% |
| Minnesota | 458 | 488 | -6% |
| Kentucky | 749 | 806 | -7% |
| Arkansas | 643 | 693 | -7% |
| Louisiana | 883 | 972 | -9% |
| South Carolina | 1,085 | 1,198 | -9% |
| Mississippi | 697 | 772 | -10% |
| South Dakota | 128 | 148 | -14% |
| Montana | 206 | 239 | -14% |
| Rhode Island | 54 | 63 | -14% |
| Idaho | 219 | 271 | -19% |
| Source: Data comes from the NHTSA 2022 Traffic Safety Facts report. The fatality estimate is based on the best available data at the time of this publishing.**Oklahoma is transitioning to a new crash data collection system and database. | |||
Distracted driving is the leading cause of auto fatalities, followed by speeding. Seasonality also plays a major role in the dangers on American roadways. The late summer and early fall tend to be the most perilous times of year to drive, with August being the most dangerous month. Labor Day accounts for the most traffic deaths over a holiday and is considered the deadliest holiday to be on the road, according to the Insurance Information Institute.
Demographic breakdown of fatal crashes
People of color and people between the ages of 65 and older have been disproportionately affected by the increase in fatal crashes from 2021 to 2022. The number of traffic fatalities rose 23% among Black people and 6% among people ages 65 and up, while every other age group saw a decrease.
Most dangerous types of roads
The type of roadway and method of transportation have a substantial impact on the severity of a crash. Slow rural roads and rural highways saw the biggest increases in fatal crashes, while urban roads became safer over the past year.
Fatalities involving pedestrians decreased, but deaths increased 11% for pedal cyclists. Although speeding is a top cause of traffic accidents nationwide, fatalities caused by speeding decreased 6%. Incidents involving large trucks increased 13% from 2020 to 2021, but increased only 2% from 2021 to 2022.
| Road | 2021 | 2022 | % change from 2021 |
|---|---|---|---|
| Interstate | 2,046 | 2,153 | 5% |
| Urban interstate | 3,632 | 3,637 | 0% |
| Rural arterial | 7,845 | 8,411 | 7% |
| Urban arterial | 16,506 | 15,508 | -6% |
| Rural collector | 7,301 | 7,913 | 8% |
| Urban collector | 5,609 | 5,172 | -8% |
| Type | 2022 | 2021 | % change from 2021 |
|---|---|---|---|
| Driver | 21,388 | 21,786 | -2% |
| Passenger | 6,371 | 6,527 | -2% |
| Motorcycle | 6,000 | 5,932 | 1% |
| Pedestrian | 7,345 | 7,388 | -1% |
| Pedal cyclist | 1068 | 966 | 11% |
| Large truck | 5,887 | 5,788 | 2% |
Methodology
Traffic fatality data was sourced from the National Highway Traffic Safety Administration (NHTSA) 2022 Traffic Safety Facts. Traffic fatality demographic data, roadway and type were sourced from a separate NHTSA Crash Stats publication from 2022. Definitions for types of fatalities and roadway categories follow NHTSA guidelines.
QuoteWizard.com LLC has made every effort to ensure that the information on this site is correct, but we cannot guarantee that it is free of inaccuracies, errors, or omissions. All content and services provided on or through this site are provided "as is" and "as available" for use. QuoteWizard.com LLC makes no representations or warranties of any kind, express or implied, as to the operation of this site or to the information, content, materials, or products included on this site. You expressly agree that your use of this site is at your sole risk.