
For over 50 years, April 22 has marked Earth Day, an international day of celebration held to demonstrate and promote environmental awareness. As climate change continues to affect our planet, our team of analysts looked at how these ecological shifts also impact our health.
Key findings:
- New Mexico and Oklahoma have the most air and water pollution, while Hawaii and North Dakota have the lowest pollution levels.
- Air quality is the worst in California, followed by New Mexico and Arizona.
- In 2022, California had a total of 67% “good” air quality days, while Hawaii had 99%.
- West Virginia, New Jersey and Mississippi have the most polluted water.
- Over 10% of the population in West Virginia was affected by drinking water violations.
- Thirteen states had zero drinking water violations in 2021.
Where the environment poses the greatest risk to Americans' physical health
The most common environmental health hazards are air and water pollution. Exposure to air pollution and contaminated water can have adverse effects and ultimately harm our physical health. QuoteWizard evaluated these two environmental factors to determine which states are the most polluted.
| Rank | State | Air quality rank | Drinking water rank |
|---|---|---|---|
| 1 | New Mexico | 2 | 6 |
| 2 | Oklahoma | 5 | 7 |
| 3 | Mississippi | 17 | 3 |
| 4 | Arizona | 3 | 14 |
| 5 | New Jersey | 18 | 2 |
| 6 | Texas | 7 | 13 |
| 7 | Louisiana | 16 | 8 |
| 8 | Alabama | 10 | 19 |
| 9 | Kansas | 24 | 10 |
| 10 | Wisconsin | 30 | 5 |
| 11 | West Virginia | 35 | 1 |
| 12 | Pennsylvania | 19 | 14 |
| 13 | Alaska | 32 | 4 |
| 14 | Florida | 26 | 11 |
| 15 | Tennessee | 21 | 14 |
| 16 | Indiana | 20 | 18 |
| 17 | Idaho | 31 | 8 |
| 18 | Georgia | 14 | 22 |
| 19 | Colorado | 4 | 28 |
| 20 | Missouri | 15 | 22 |
| 21 | Illinois | 9 | 28 |
| 22 | Michigan | 11 | 28 |
| 23 | Ohio | 12 | 28 |
| 24 | Oregon | 29 | 19 |
| 25 | Nevada | 13 | 28 |
| 26 | California | 1 | 50 |
| 27 | Minnesota | 43 | 12 |
| 28 | Utah | 6 | 50 |
| 29 | Delaware | 8 | 50 |
| 30 | Connecticut | 22 | 28 |
| 31 | Arkansas | 34 | 22 |
| 32 | Vermont | 40 | 19 |
| 33 | Washington | 45 | 14 |
| 34 | Wyoming | 36 | 22 |
| 35 | Montana | 41 | 22 |
| 36 | Maryland | 23 | 50 |
| 37 | Kentucky | 25 | 50 |
| 38 | New York | 38 | 28 |
| 39 | New Hampshire | 48 | 22 |
| 40 | Iowa | 27 | 50 |
| 41 | South Carolina | 28 | 50 |
| 42 | South Dakota | 42 | 28 |
| 43 | Virginia | 44 | 28 |
| 44 | North Carolina | 33 | 50 |
| 45 | Nebraska | 47 | 28 |
| 46 | Massachusetts | 37 | 50 |
| 47 | Rhode Island | 39 | 50 |
| 48 | Maine | 46 | 50 |
| 49 | North Dakota | 49 | 50 |
| 50 | Hawaii | 50 | 50 |
| Methodology: Air quality data is from the EPA and drinking water data is from America’s Health Rankings. States were ranked from worst to best in each category, with 1 being the worst and 50 being the best. States were then given a composite score on which the overall state rankings are based. | |||
After evaluating healthy drinking water and air quality scores across the nation, our team determined that New Mexico, Oklahoma and Mississippi are the most polluted states overall. The states with the worst drinking water are West Virginia and New Jersey. For air quality, the most unhealthy state is California, followed by New Mexico and Arizona.
When it comes to clean air and healthy drinking water, Hawaii ranks best in both categories. The Aloha State’s combined score makes it the safest regarding environmental factors on our health. Thirteen states in total tied for best drinking water. Given that it’s a serious issue and growing environmental concern, the overall drinking water quality across the United States is generally safe.
Air quality and health risks
Poor air quality can have significant health implications for people who live in areas with higher rates of pollution. This is especially true for high-risk individuals, such as those with cardiovascular and respiratory conditions like asthma or chronic obstructive pulmonary disease (COPD).
In addition, poor air quality has been linked to an increased risk of heart disease, stroke and lung cancer, as well as a range of other health problems. Long-term exposure to air pollution can also have a cumulative effect on health, making it important to take steps to reduce exposure where possible, such as by avoiding high-traffic areas or using air filters indoors.
Some states rank better than others when it comes to air quality. Over the last five years, Hawaii on average had the most “good” air quality days, at 99%, followed by New Hampshire, at 95%. Compare that to California, which saw only 67% "good" air quality days.
| State | % of "good" air quality days |
|---|---|
| California | 67% |
| Arizona | 68% |
| New Mexico | 68% |
| Colorado | 70% |
| Oklahoma | 71% |
| Utah | 71% |
| Texas | 75% |
| Delaware | 77% |
| Alabama | 80% |
| Illinois | 80% |
| Michigan | 80% |
| Nevada | 81% |
| Ohio | 81% |
| Georgia | 82% |
| Louisiana | 83% |
| Mississippi | 83% |
| Missouri | 83% |
| Indiana | 84% |
| New Jersey | 84% |
| Pennsylvania | 84% |
| Tennessee | 84% |
| Connecticut | 85% |
| Kansas | 85% |
| Kentucky | 85% |
| Maryland | 85% |
| Florida | 86% |
| Iowa | 86% |
| South Carolina | 87% |
| Alaska | 88% |
| Idaho | 88% |
| North Carolina | 88% |
| Oregon | 88% |
| Wisconsin | 88% |
| Arkansas | 89% |
| West Virginia | 89% |
| Wyoming | 89% |
| Massachusetts | 90% |
| New York | 90% |
| Rhode Island | 90% |
| Vermont | 90% |
| Minnesota | 92% |
| Montana | 92% |
| South Dakota | 92% |
| Maine | 93% |
| Nebraska | 93% |
| Virginia | 93% |
| Washington | 93% |
| New Hampshire | 95% |
| North Dakota | 95% |
| Hawaii | 99% |
| Methodology: Percent of "good" air quality days represents the percentage of days with good air quality, based on AQI County data from 2022. | |
The most unhealthy state when it comes to air quality is California. The state received the worst overall score given the lowest percent of “good” air quality days, with a total of 67% over a five-year period. Nationally, many factors contribute to poor air quality, including smoke from natural disasters such as wildfires and smog in larger cities.
California is home to some of the largest metro areas in the country, which contribute to high levels of smog. The state's poor air quality is heavily due to car emissions that cause particulate matter and ozone to pollute the air. Another concern for California residents is the growing number of wildfires across the state. Wildfire smoke emissions have increased significantly in recent years and are a massive contributor to the overall air quality in the Golden State. The table below shows the top three counties in California which saw the greatest number of “unhealthy” air quality days and are considered the most air-polluted counties in California.
| Rank | County | % of good days | % of unhealthy days |
|---|---|---|---|
| 1 | Riverside | 20% | 33% |
| 2 | San Bernardino | 13% | 30% |
| 3 | Tulare | 33% | 22% |
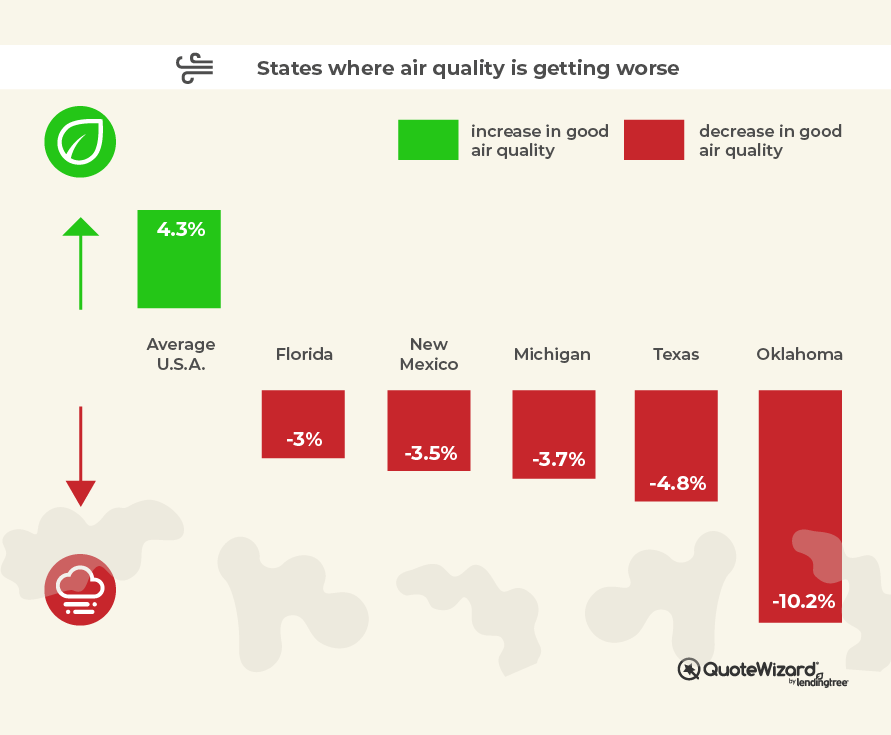
Good air quality days are becoming more common nationwide, and although air quality is generally improving across the nation, a total of nine states saw a decrease in the percentage of “good” air quality days over the last five years, from 2018 to 2022. The state with the largest decrease was Oklahoma, at 10.2%, compared to the national average, which increased over time to 4.3% more “good” days.
Water pollution issues
The federal government has implemented regulations, such as the Clean Water Act, to limit water pollution and protect water quality for all Americans. However, continued efforts are necessary to address ongoing threats to the nation's water resources.
There are various causes of contamination in drinking water in the U.S. Agricultural practices (fertilizers and pesticides used near water), poor infrastructure and natural events, such as floods and storms, can lead to contamination by washing pollutants into water sources. The Norfolk Southern train derailment in East Palestine, Ohio, in February is a sobering reminder of how quickly human-caused disasters can threaten our water supplies and other natural resources.
West Virginia ranked worst overall for poor drinking water, with a total of 10.2% of its population affected by drinking water violations. The Elk River chemical spill of 2014 caused serious contamination of West Virginia's water supply. Since the aftermath of the chemical spill, the EPA has funded support and resources for water protection efforts. Nationally, healthy drinking water is less of an issue than air pollution. A total of 13 states reported no drinking water violations, while more than half of states saw figures below 1%.
| State | % of population affected by drinking water violations |
|---|---|
| West Virginia | 10.2% |
| New Jersey | 8.9% |
| Mississippi | 6.3% |
| Alaska | 4.8% |
| Wisconsin | 4.4% |
| New Mexico | 2.9% |
| Oklahoma | 2.4% |
| Louisiana | 1.8% |
| Idaho | 1.8% |
| Kansas | 1.7% |
| Florida | 1.3% |
| Minnesota | 1.1% |
| Texas | 0.8% |
| Washington | 0.5% |
| Tennessee | 0.5% |
| Pennsylvania | 0.5% |
| Arizona | 0.5% |
| Indiana | 0.4% |
| Vermont | 0.3% |
| Oregon | 0.3% |
| Alabama | 0.3% |
| Wyoming | 0.2% |
| New Hampshire | 0.2% |
| Montana | 0.2% |
| Missouri | 0.2% |
| Georgia | 0.2% |
| Arkansas | 0.2% |
| Virginia | 0.1% |
| South Dakota | 0.1% |
| Ohio | 0.1% |
| New York | 0.1% |
| Nevada | 0.1% |
| Nebraska | 0.1% |
| Michigan | 0.1% |
| Illinois | 0.1% |
| Connecticut | 0.1% |
| Colorado | 0.1% |
| Utah | 0.0% |
| South Carolina | 0.0% |
| Rhode Island | 0.0% |
| North Dakota | 0.0% |
| North Carolina | 0.0% |
| Massachusetts | 0.0% |
| Maryland | 0.0% |
| Maine | 0.0% |
| Kentucky | 0.0% |
| Iowa | 0.0% |
| Hawaii | 0.0% |
| Delaware | 0.0% |
| California | 0.0% |
| Source: America’s Health Rankings | |
The impact of climate change on our health care system
Climate-related disasters impact health care in multiple ways. Heatwaves, wildfire smoke and hazardous-waste releases can cause outbreaks of acute conditions that require immediate treatment. Prolonged exposure to toxins can lead to chronic conditions that may require ongoing care. As the price of treating those with pollution-related illnesses increases, health insurance costs often also rise for others in impacted areas.
“The standards that have been established since the first Earth Day took place are having a positive impact on our air and water quality, but more needs to be done. When you consider the widespread risks that pollution poses to public health, it’s clear that we all have a stake in environmental protection.” — Rob Bhatt, QuoteWizard Analyst
Methodology
The most polluted states table is based on a composite score of the percent of good air quality days and the percent of the population affected by drinking water violations, according to America’s Health Rankings by the United Health Foundation. States were ranked best to worst in each category, with 1 being the best and 50 being the worst.
QuoteWizard analysts evaluated the Environmental Protection Agency's (EPA) Air Quality Index (AQI) measurements from 2022. Our team used data representing local air quality as “good” and found the % of “good” days for each state.
The five pollutants covered by the AQI are:
- Ozone (O3)
- Particulate matter (PM10 and PM2.5)
- Carbon monoxide (CO)
- Nitrogen dioxide (NO2)
- Sulfur dioxide (SO2)
To determine drinking water quality, we used America’s Health Rankings 2021 data on drinking water violations. States were ranked 1 to 50 based on the percentage of serious drinking water violations that occurred during the year.
References:
QuoteWizard.com LLC has made every effort to ensure that the information on this site is correct, but we cannot guarantee that it is free of inaccuracies, errors, or omissions. All content and services provided on or through this site are provided "as is" and "as available" for use. QuoteWizard.com LLC makes no representations or warranties of any kind, express or implied, as to the operation of this site or to the information, content, materials, or products included on this site. You expressly agree that your use of this site is at your sole risk.